


USD/CAD slides as Trump’s criticism of Fed Chair Powell weighs on US Dollar
- The Canadian Dollar gains modestly as political pressure on the Fed weighs on the US Dollar.
- USD/CAD trades near 1.3630, down 0.70% on the day, staying within a descending channel.
- The technical outlook remains bearish, with immediate support seen at the lower Bollinger Band around 1.3587.
The Canadian Dollar (CAD) ticks higher against the US Dollar (USD) on Thursday, buoyed by broad-based Greenback weakness following fresh criticism of Federal Reserve (Fed) Chair Jerome Powell by the US President Donald Trump. The remarks, which reignited concerns over political interference in monetary policy, dented investor confidence in the Fed’s independence, weighing on the US Dollar and offering modest support to the Loonie.
The USD/CAD pair is edging lower, trading around 1.3631 at the time of writing, down 0.70% on the day. The pair had been rangebound for most of the week, showing little directional bias as the Canadian Dollar struggled to find traction amid declining Oil prices. Easing geopolitical tensions have weighed on energy markets, limiting support for the commodity-linked Loonie despite the broader US Dollar weakness.
Meanwhile, the US Dollar Index (DXY), which gauges the Greenback’s strength against a basket of six major currencies, is hovering near 97.22—its lowest level in almost three years. Mixed US economic data released on Thursday added to the cautious tone, limiting any upside in the US Dollar.
While Durable Goods orders surged in May, indicating resilience in the manufacturing sector. The US economy contracted 0.5% in Q1 2025—a deeper decline than the previously estimated 0.2%—highlighting underlying economic softness. In another sign of a cooling economy, US Initial Jobless Claims fell by 9,000 to 236,000 in the week ending June 21, coming in below expectations. However, claims remain elevated compared to the yearly average, suggesting a waning momentum in the labor market despite the weekly decline.
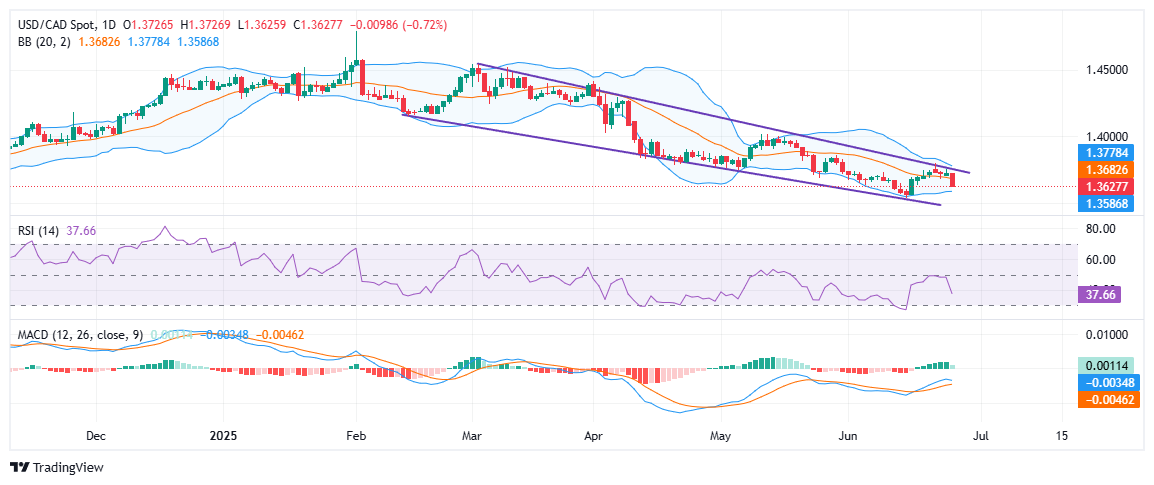
From a technical perspective, USD/CAD remains trapped within a well-defined descending channel, with the latest rejection near the upper boundary reaffirming the bearish structure. The pair is currently trading near 1.3630 after failing to break above trendline resistance drawn from the March and May highs.
The Bollinger Bands are tightening, indicating that the market may be preparing for a significant move soon, with immediate support located around the lower band at 1.3587. A decisive breakdown below this level could expose the 1.3500 psychological mark, while a sustained move above 1.3680 would be needed to challenge the 1.3778 horizontal resistance and the channel top.
Momentum indicators paint a cautious picture, with signs of weakening bullish attempts. The Relative Strength Index (RSI) is hovering around 38, remaining below the 50-neutral mark, indicating that bearish momentum still prevails. Meanwhile, the Moving Average Convergence Divergence (MACD) histogram shows early signs of convergence, with the MACD line trying to cross above the signal line from below—often a preliminary bullish sign—but not yet confirmed. For bulls to gain meaningful control, a break above the descending channel is essential. Until then, the path of least resistance remains to the downside.
Recommended Articles


