
GBP/USD holds above 1.3600 as ceasefire lifts mood, BoE turns dovish
- GBP/USD rises 0.05% above 1.3600 as market mood brightens on Middle East ceasefire.
- BoE’s Bailey signals possible rate cuts ahead amid soft labor data, capping Sterling gains.
- Powell and Fed’s Collins maintain wait-and-see stance; weak US new home sales deepen rate-cut speculation.
The Pound Sterling extends its gains to three straight days during the week, amid an upbeat market mood triggered by the ceasefire of the Israel-Iran conflict. Nevertheless, the truce remains fragile after both parties exchanged blows close to or after the deadline proposed by Washington. The GBP/USD trades above 1.3600 after falling below it earlier, up 0.05%.
Sterling extends 3-day rally amid fragile Israel–Iran truce and dovish BoE signals, while Powell maintains cautious tone
Today is the second and latest appearance of Fed Chair Jerome Powell's semi-annual testimony at the US Congress. He is expected to deliver the same message, of a wait-and-see mode at the central bank, as they assess the possible impact of tariffs on inflation. He stated that tariffs one-impact on inflation, but he wants to approach it carefully when inflation is not back at 2%.
Earlier, Boston Fed Susan Collins echoed yesterday's words, saying that monetary policy is well-positioned, that the US economy is solid, and that there’s time for patience.
Data-wise, US New Home Sales dipped in May, -13.7% from 722,000 in April to 623,000. Analysts were expecting a decline to 693,000 units. Elevated 30-year mortgage rates, nearly 7% are the cause of consumers refraining from buying new houses.
In the UK, a dovish tilt by Bank of England (BoE) Governor Andrew Bailey, capped the GBP/USD advance as he stated that rates could move lower, tough cautiously due to a softening jobs market.
During the week, the UK economic docket will feature BoE speakers and the release of growth figures. In the US, Durable Goods Orders, Fed speeches, GDP, and inflation data could set the tone for the GBP/USD pair.
GBP/USD Price Forecast: Technical Outlook
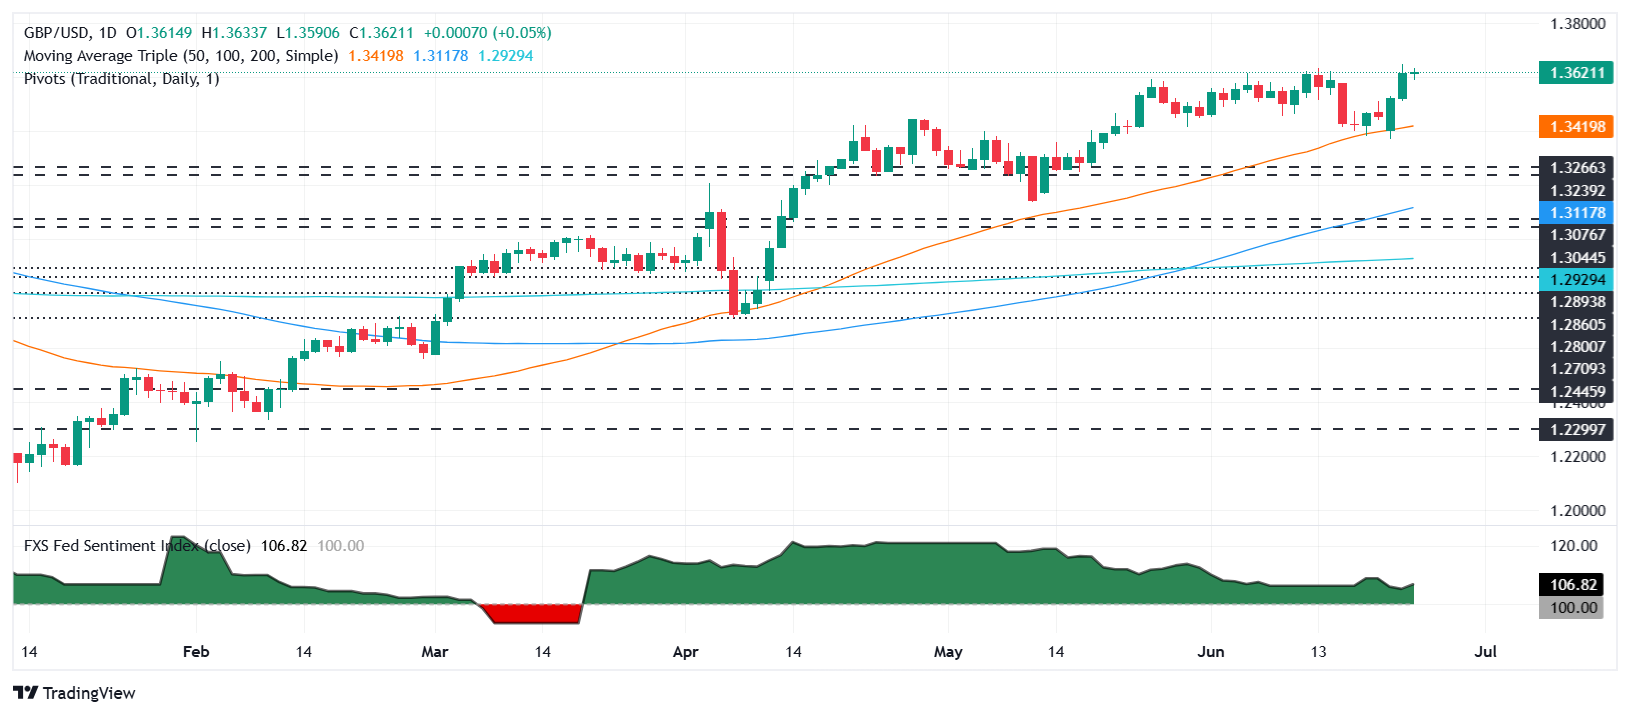
The GBP/USD reached a new yearly high at 1.3641, potentially opening the door for further upside. However, it is worth noting that a daily close below 1.3600 could sponsor a pullback. Nevertheless, the Relative Strength Index (RSI) suggests the pair might consolidate after turning flat.
GBP/USD upside resistance lies at 1.3644/50, followed by 1.3700. A breach of the latter will expose 1.3750. Conversely, if the pair tumbles below 1.3600, look for sellers testing the 20-day Simple Moving Average (SMA) at 1.3524. If surpassed, the next stop would be the 50-day SMA at 1.3415.
British Pound PRICE This week
The table below shows the percentage change of British Pound (GBP) against listed major currencies this week. British Pound was the strongest against the US Dollar.
| USD | EUR | GBP | JPY | CAD | AUD | NZD | CHF | |
|---|---|---|---|---|---|---|---|---|
| USD | -1.43% | -1.59% | -0.76% | -0.06% | -0.98% | -1.20% | -1.42% | |
| EUR | 1.43% | -0.20% | 0.75% | 1.39% | 0.41% | 0.24% | -0.02% | |
| GBP | 1.59% | 0.20% | 0.97% | 1.59% | 0.60% | 0.43% | 0.17% | |
| JPY | 0.76% | -0.75% | -0.97% | 0.67% | -0.26% | -0.40% | -0.76% | |
| CAD | 0.06% | -1.39% | -1.59% | -0.67% | -0.87% | -1.13% | -1.39% | |
| AUD | 0.98% | -0.41% | -0.60% | 0.26% | 0.87% | -0.19% | -0.44% | |
| NZD | 1.20% | -0.24% | -0.43% | 0.40% | 1.13% | 0.19% | -0.26% | |
| CHF | 1.42% | 0.02% | -0.17% | 0.76% | 1.39% | 0.44% | 0.26% |
The heat map shows percentage changes of major currencies against each other. The base currency is picked from the left column, while the quote currency is picked from the top row. For example, if you pick the British Pound from the left column and move along the horizontal line to the US Dollar, the percentage change displayed in the box will represent GBP (base)/USD (quote).
Recommended Articles


