


NZD/USD Price Forecast: Tests ascending channel’s lower boundary near 0.6000
- NZD/USD may find initial resistance at the nine-day EMA of 0.6028.
- The 14-day Relative Strength Index remains above the 50 mark, suggesting a bullish bias is in play.
- A break below the lower boundary of the ascending channel near 0.6020 could signal the onset of a bearish bias.
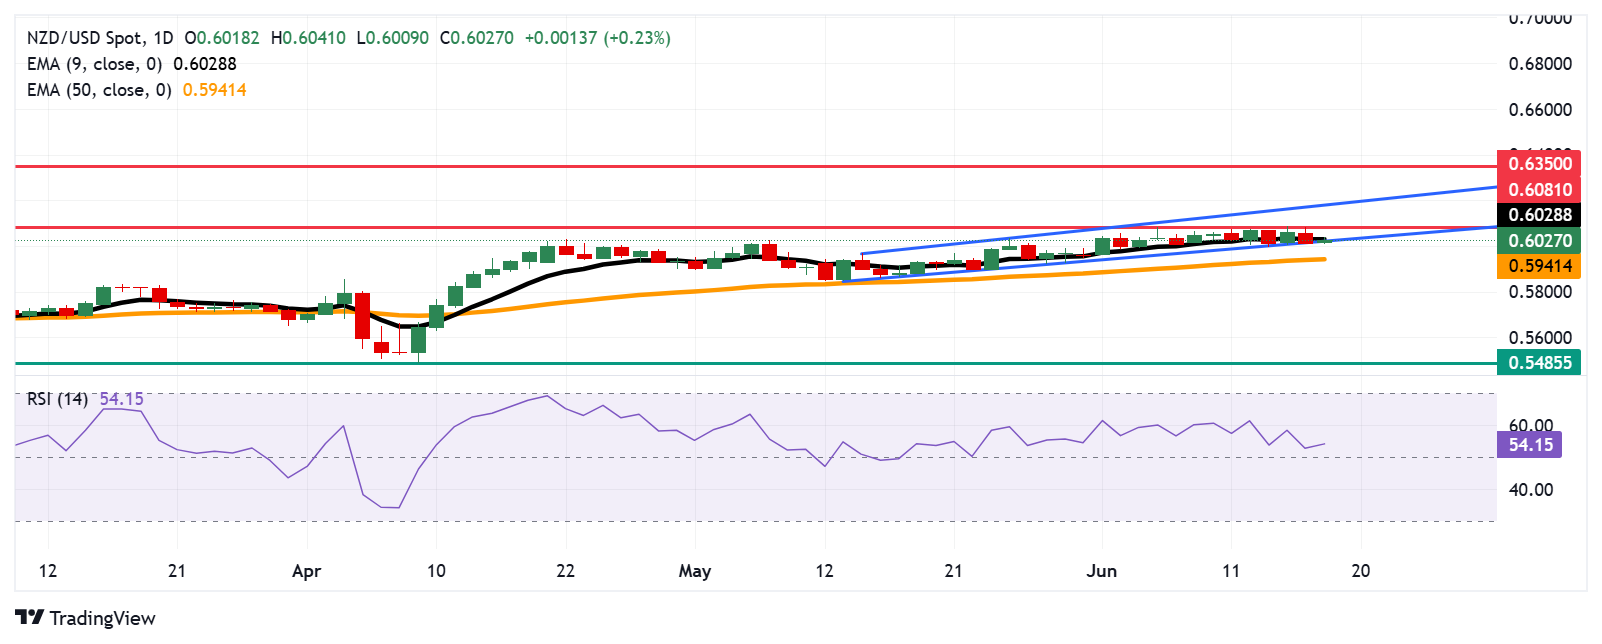
NZD/USD is retracing its recent losses, trading around 0.6030 during the European hours on Wednesday. The technical analysis of the daily chart suggests the potential for weakening bullish bias, as the pair tests the lower boundary of the ascending channel pattern.
The short-term price momentum is weaker as the NZD/USD pair is positioned slightly below the nine-day Exponential Moving Average (EMA). However, the bullish sentiment is still in play as the 14-day Relative Strength Index (RSI) is remaining just above the 50 mark.
The NZD/USD pair may target the nine-day EMA of 0.6028, followed by the eight-month high of 0.6081, marked on June 5. Further advances above this level may reinforce the bullish bias and support the pair to test the upper boundary of the ascending channel around 0.6190. A successful break above the channel could support the pair to approach the nine-month high of 0.6350, marked in October 2024.
On the downside, a break below the lower boundary of the ascending channel around 0.6020 could cause the emergence of the bearish bias and put downward pressure on the pair to test the 50-day EMA at 0.5941. A break below this level could weaken the medium-term price momentum and pave the way for a deeper decline toward 0.5485, a level not seen since March 2020.
NZD/USD: Daily Chart
New Zealand Dollar PRICE Today
The table below shows the percentage change of New Zealand Dollar (NZD) against listed major currencies today. New Zealand Dollar was the strongest against the Swiss Franc.
| USD | EUR | GBP | JPY | CAD | AUD | NZD | CHF | |
|---|---|---|---|---|---|---|---|---|
| USD | -0.23% | -0.23% | -0.17% | 0.01% | -0.23% | -0.17% | 0.11% | |
| EUR | 0.23% | 0.00% | -0.02% | 0.15% | -0.11% | 0.13% | 0.34% | |
| GBP | 0.23% | -0.01% | 0.02% | 0.16% | -0.11% | -0.00% | 0.35% | |
| JPY | 0.17% | 0.02% | -0.02% | 0.23% | -0.02% | 0.25% | 0.54% | |
| CAD | -0.01% | -0.15% | -0.16% | -0.23% | -0.23% | -0.15% | 0.21% | |
| AUD | 0.23% | 0.11% | 0.11% | 0.02% | 0.23% | 0.24% | 0.47% | |
| NZD | 0.17% | -0.13% | 0.00% | -0.25% | 0.15% | -0.24% | 0.23% | |
| CHF | -0.11% | -0.34% | -0.35% | -0.54% | -0.21% | -0.47% | -0.23% |
The heat map shows percentage changes of major currencies against each other. The base currency is picked from the left column, while the quote currency is picked from the top row. For example, if you pick the New Zealand Dollar from the left column and move along the horizontal line to the US Dollar, the percentage change displayed in the box will represent NZD (base)/USD (quote).
Recommended Articles


