


AUD/NZD Price Analysis: Cross holds steady near 1.09 amid mixed momentum
- AUD/NZD trades near the 1.09 zone on Monday, reflecting minor gains.
- The cross maintains a bullish tone despite mixed short-term signals.
- Key support is clustered below 1.0880, with resistance near 1.0910.
The AUD/NZD pair is trading near the 1.09 zone on Monday, reflecting a cautiously bullish tone as the market approaches the Asian session. Despite the broader uptrend, the pair remains within a tight daily range, suggesting that traders are adopting a wait-and-see approach amid mixed technical signals. The overall sentiment leans positive, but shorter-term indicators highlight potential headwinds in the coming sessions.
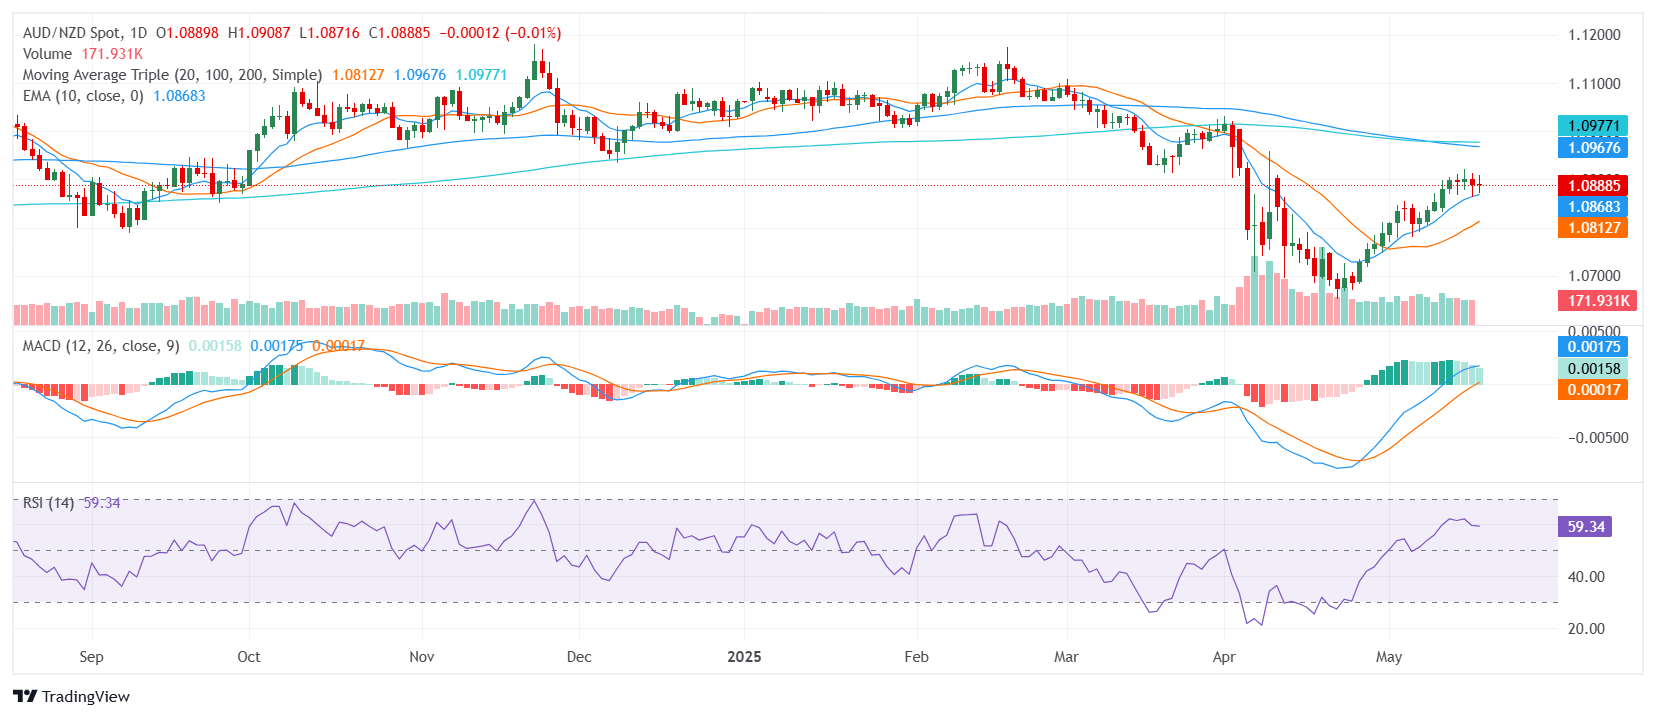
The daily technical setup shows a generally supportive environment for the pair. The Relative Strength Index (RSI) is in the 50s, indicating neutral momentum, while the Moving Average Convergence Divergence (MACD), which captures trend-following momentum, signals a clear buy bias. This is supported by the 20-day Simple Moving Average (SMA), which aligns with the broader bullish trend. However, the 100-day and 200-day SMAs remain in sell territory, suggesting that the broader outlook still faces structural resistance.
Other momentum indicators present a more mixed picture. The Ultimate Oscillator (7, 14, 28) trades in the 60s, reflecting largely neutral conditions, while the Bull Bear Power and the Awesome Oscillator both hover around zero, highlighting the ongoing struggle between buyers and sellers. This neutral tone is mirrored by the 10-day Exponential Moving Average (EMA) and 10-day SMA, both aligning with the near-term buy sentiment but lacking strong follow-through signals.
Shifting to the 4-hour timeframe, the outlook becomes more cautious. The 4-hour Relative Strength Index (RSI), Commodity Channel Index (CCI), and Stochastic RSI all point to neutral momentum, reinforcing the potential for near-term consolidation. Meanwhile, the 4-hour 10 and 20-day EMAs and SMAs indicate selling, suggesting that shorter-term momentum is at odds with the broader daily uptrend, potentially limiting immediate upside.
For now, immediate support is found around 1.0872, with additional levels at 1.0868 and 1.0867. On the upside, resistance is likely to emerge around 1.0906, followed closely by 1.0922 and 1.0944, potentially capping further gains as the pair attempts to break through the upper end of its recent range. Broader Fibonacci levels place deeper support in the 1.0400 to 1.0700 range, while resistance extends toward 1.1000, 1.1100, and 1.1200, providing a wider context for potential breakout scenarios.
Daily Chart
Recommended Articles


