AUD/NZD Price Analysis: Aussie holds near 1.0800 as bullish signals persist

Source Fxstreet
  • AUD/NZD trades near the 1.0800 zone after modest gains in Friday’s session.
  • Short-term indicators favor buyers, despite mixed longer-term signals.
  • Key support levels hold below, while resistance aligns near recent highs.

The AUD/NZD pair edged higher on Friday, trading near the 1.0800 zone after the European session, reflecting a steady bullish tone as the market heads into the Asian session. Price action remains within the middle of the day’s range, suggesting that buyers maintain control despite some longer-term resistance levels. The immediate outlook is supported by rising short-term averages, though broader challenges remain.

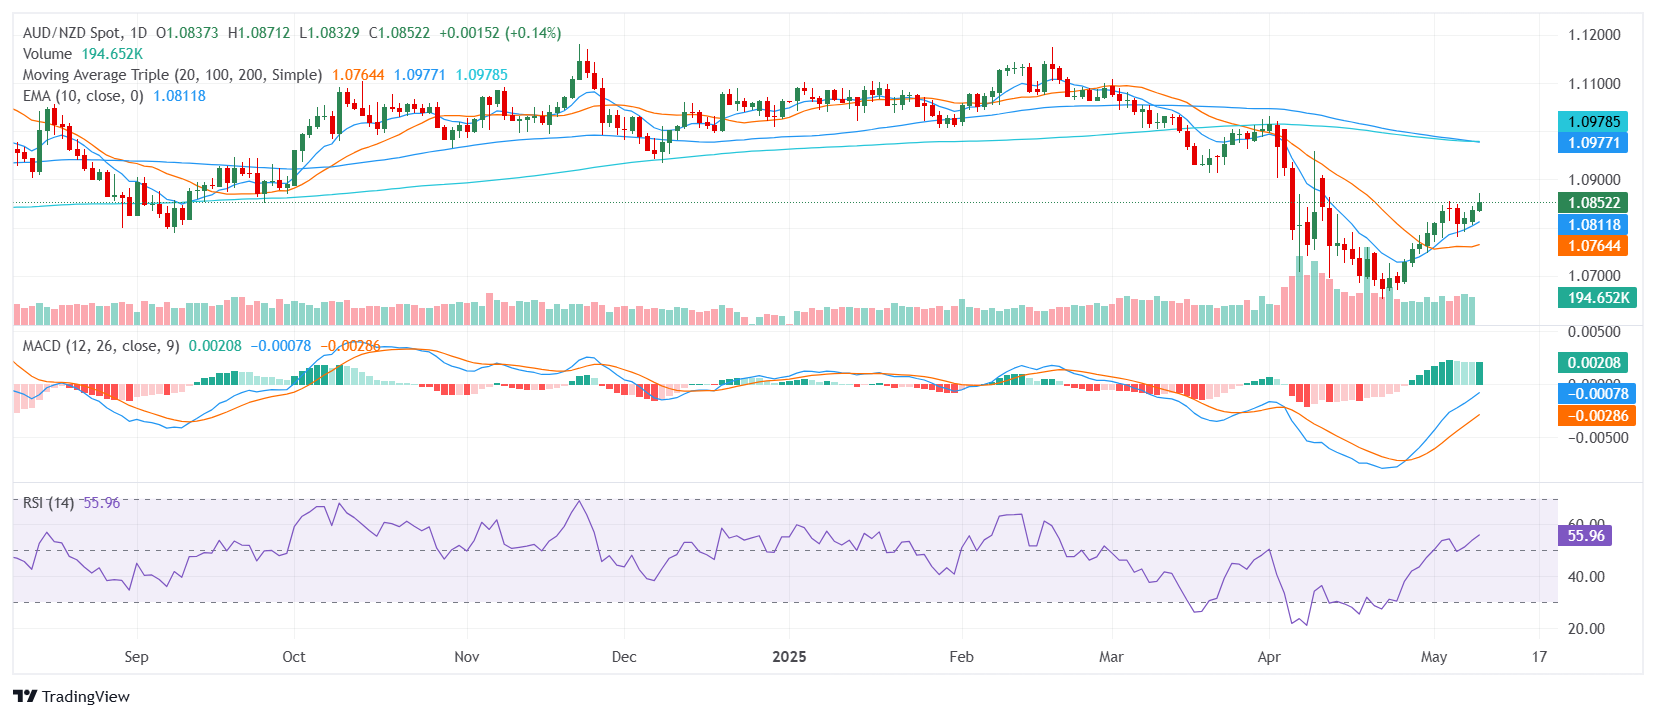
From a technical perspective, the pair is flashing a bullish overall signal. The Relative Strength Index remains neutral near 55, indicating balanced momentum without immediate overbought conditions. The Moving Average Convergence Divergence confirms the broader uptrend with a buy signal, reinforcing the positive tone. Meanwhile, the Bull Bear Power and Ultimate Oscillator are both neutral, highlighting the absence of extreme momentum in either direction.

The short-term trend structure is supportive of further gains. The 10-day and 20-day Simple Moving Averages, positioned below the current price, both slope upward, providing dynamic support for the ongoing uptrend. However, the longer-term 100-day and 200-day Simple Moving Averages remain above current levels and continue to trend lower, suggesting that broader selling pressure may still limit the upside over the medium term.

Support is located at 1.0837, 1.0825, and 1.0811. Resistance is found at 1.0866, 1.0883, and 1.0925. A break above the immediate resistance zone could confirm a broader breakout, while a move below support might trigger a short-term correction, potentially testing the lower end of the recent range.

Daily Chart

Disclaimer: For information purposes only. Past performance is not indicative of future results.
placeholder
BTC Hovers Near 60,000 Mark After Plunge. US May CPI Set to Be Revealed, How Is Wall Street Betting?Bitcoin's rebound falters as the U.S.-Iran conflict and CPI data likely sustain downward pressure.On June 10, escalating U.S.-Iran tensions put the already fragile crypto market to the te
Author  TradingKey
12 hours ago
Bitcoin's rebound falters as the U.S.-Iran conflict and CPI data likely sustain downward pressure.On June 10, escalating U.S.-Iran tensions put the already fragile crypto market to the te
placeholder
Gold plummets below $4,200 as US‑Iran tensions spur hawkish rate bets ahead of US CPIGold (XAU/USD) extends the recent breakdown momentum below a technically significant 200-day Simple Moving Average (SMA) and drops to a fresh low since March 23, further below the $4,200 mark during the Asian session on Wednesday.
Author  FXStreet
13 hours ago
Gold (XAU/USD) extends the recent breakdown momentum below a technically significant 200-day Simple Moving Average (SMA) and drops to a fresh low since March 23, further below the $4,200 mark during the Asian session on Wednesday.
placeholder
Gold Prices Fall for Four Consecutive Months, Has the Precious Metals Bull Market Partially Ended? Where Is the Next Support Level?Gold Prices ( XAUUSD) Slump for Four Consecutive Months: Has the Precious Metals Bull Market Partially Ended? Where Is the Next Support Level?Year-to-date, international gold prices have
Author  TradingKey
14 hours ago
Gold Prices ( XAUUSD) Slump for Four Consecutive Months: Has the Precious Metals Bull Market Partially Ended? Where Is the Next Support Level?Year-to-date, international gold prices have
placeholder
WTI steadies around $87.50 despite renewed supply concernsWest Texas Intermediate (WTI) oil price experiences volatility after registering over 2.5% losses in the previous day, trading around $87.40 per barrel during the Asian hours on Wednesday.
Author  FXStreet
20 hours ago
West Texas Intermediate (WTI) oil price experiences volatility after registering over 2.5% losses in the previous day, trading around $87.40 per barrel during the Asian hours on Wednesday.
placeholder
US May CPI Preview: Rising Inflation May Push Up Fed Rate Hike Expectations, How Will US Stocks, Dollar, Gold React? The U.S. Bureau of Labor Statistics will release May CPI data at 8:30 AM ET on June 10. This report is the most critical inflation reading ahead of the Federal Reserve's policy meeting on
Author  TradingKey
Yesterday 09: 55
The U.S. Bureau of Labor Statistics will release May CPI data at 8:30 AM ET on June 10. This report is the most critical inflation reading ahead of the Federal Reserve's policy meeting on
Related Instrument
goTop
quote