AUD/JPY Price Analysis: Struggles to hold ground ahead of the Asian session

Source Fxstreet
  • The AUD/JPY trades near the 91.30 zone with minimal gains during Monday’s session.
  • Overall bias remains bearish despite mixed technical signals.
  • Key resistance lies near 91.80, while support is seen closer to 91.10.

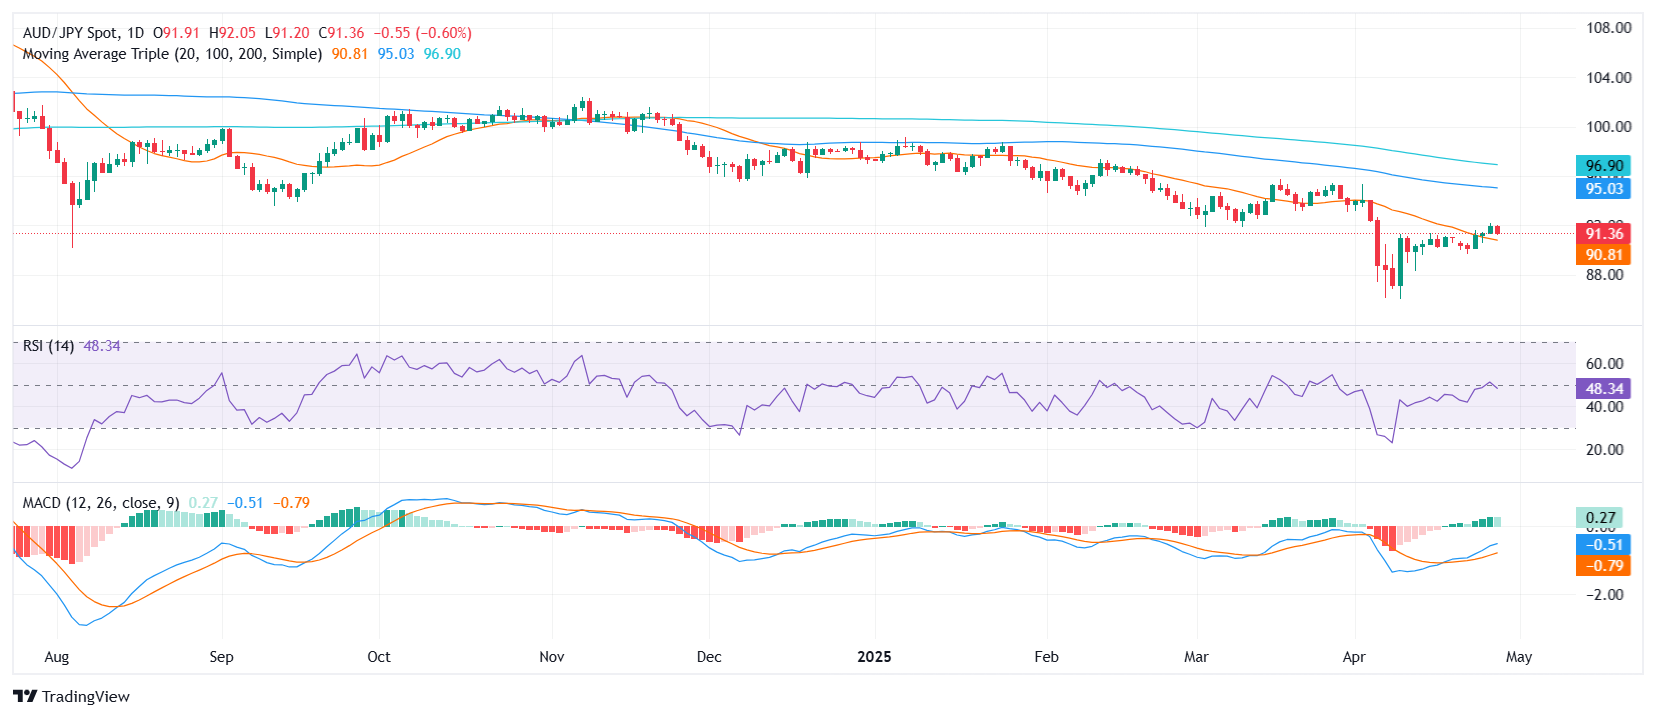
The AUD/JPY is trading close to the 91.30 area on Monday, showing very limited movement ahead of the Asian session. The pair remains stuck mid-range after a session characterized by low volatility. Despite a marginal daily gain, technical indicators provide a mixed picture: the Relative Strength Index (RSI) stays neutral around 48, the Moving Average Convergence Divergence (MACD) flashes a buy signal, while momentum and stochastic oscillators hint at mounting selling pressure. A bearish tilt remains dominant, reinforced by the 30-day Exponential Moving Average (EMA) and Simple Moving Average (SMA), as well as the 100-day and 200-day SMAs, all indicating further downside risks.

Looking deeper into the technical setup, selling signals persist as the 30-day EMA at 91.77 and 30-day SMA at 91.88 lean toward further declines. Longer-term trends also add to the bearish bias, with the 100-day SMA at 94.99 and the 200-day SMA at 96.92 firmly indicating selling pressure. Even though the 20-day SMA, positioned lower around 90.65, suggests short-term buying interest, it seems insufficient to overturn the broader negative sentiment.

Momentum indicators bolster the bearish case, with the 10-period momentum showing weakness and the stochastic %K hovering at elevated but downward-leaning levels near 86, typically a signal of potential reversal from overbought conditions. On the flip side, the MACD’s buy signal tempers the bearish outlook somewhat, hinting at possible short-term stabilization.

In terms of levels to watch, support is seen around 91.33, 91.13, and deeper near 90.98. Meanwhile, resistance is stacked near the 91.77, 91.81, and 91.88 zones, suggesting that any upside attempt could face challenges relatively quickly.

Daily chart

Disclaimer: For information purposes only. Past performance is not indicative of future results.
placeholder
US May CPI Preview: Rising Inflation May Push Up Fed Rate Hike Expectations, How Will US Stocks, Dollar, Gold React? The U.S. Bureau of Labor Statistics will release May CPI data at 8:30 AM ET on June 10. This report is the most critical inflation reading ahead of the Federal Reserve's policy meeting on
Author  TradingKey
13 hours ago
The U.S. Bureau of Labor Statistics will release May CPI data at 8:30 AM ET on June 10. This report is the most critical inflation reading ahead of the Federal Reserve's policy meeting on
placeholder
WTI Crude Oil Falls to $90 Level. Iran Situation Cools Suddenly, Strait of Hormuz June Opening Seen Unlikely On June 8, tensions in the Iran conflict cooled abruptly, and both major crude oil futures fell. WTI crude futures briefly retreated to around the $90 level. As of press time, it was up 0
Author  TradingKey
17 hours ago
On June 8, tensions in the Iran conflict cooled abruptly, and both major crude oil futures fell. WTI crude futures briefly retreated to around the $90 level. As of press time, it was up 0
placeholder
WTI edges lower to near $89.50 as Iran, Israel agree to halt attacksWest Texas Intermediate (WTI) oil price edges lower after registering over 1% losses in the previous day, trading around $89.40 per barrel during the Asian hours on Tuesday.
Author  FXStreet
22 hours ago
West Texas Intermediate (WTI) oil price edges lower after registering over 1% losses in the previous day, trading around $89.40 per barrel during the Asian hours on Tuesday.
placeholder
Gold Drops Below $4,300 Erasing Year-to-Date Gains. This Week’s CPI May Ignite Rate Hike Expectations Will Gold Still Rise in 2026?During Monday's Asian session, both spot and futures gold prices fell below the $4,300/oz support level. Spot gold touched an intraday low of $4,268.42, its lowest level since March 23, e
Author  TradingKey
Yesterday 09: 58
During Monday's Asian session, both spot and futures gold prices fell below the $4,300/oz support level. Spot gold touched an intraday low of $4,268.42, its lowest level since March 23, e
placeholder
Bitcoin Supply In Loss Crosses Critical Threshold — Bullish Reversal Next?After days of steep downward movement, the price of Bitcoin appears to have found a somewhat reliable anchor around the $60,000 region. However, recent on-chain data suggests that the premier
Author  NewsBTC
Yesterday 01: 16
After days of steep downward movement, the price of Bitcoin appears to have found a somewhat reliable anchor around the $60,000 region. However, recent on-chain data suggests that the premier
Related Instrument
goTop
quote