EUR/JPY Price Analysis: Climbs to near 162.70 followed by a psychological barrier

Source Fxstreet
  • EUR/JPY could meet the psychological resistance at the 163.00 level following February’s high at 163.72.
  • EUR/JPY cross could find immediate support at the major level of 162.50.
  • 14-day RSI indicates a bullish sentiment for the cross.

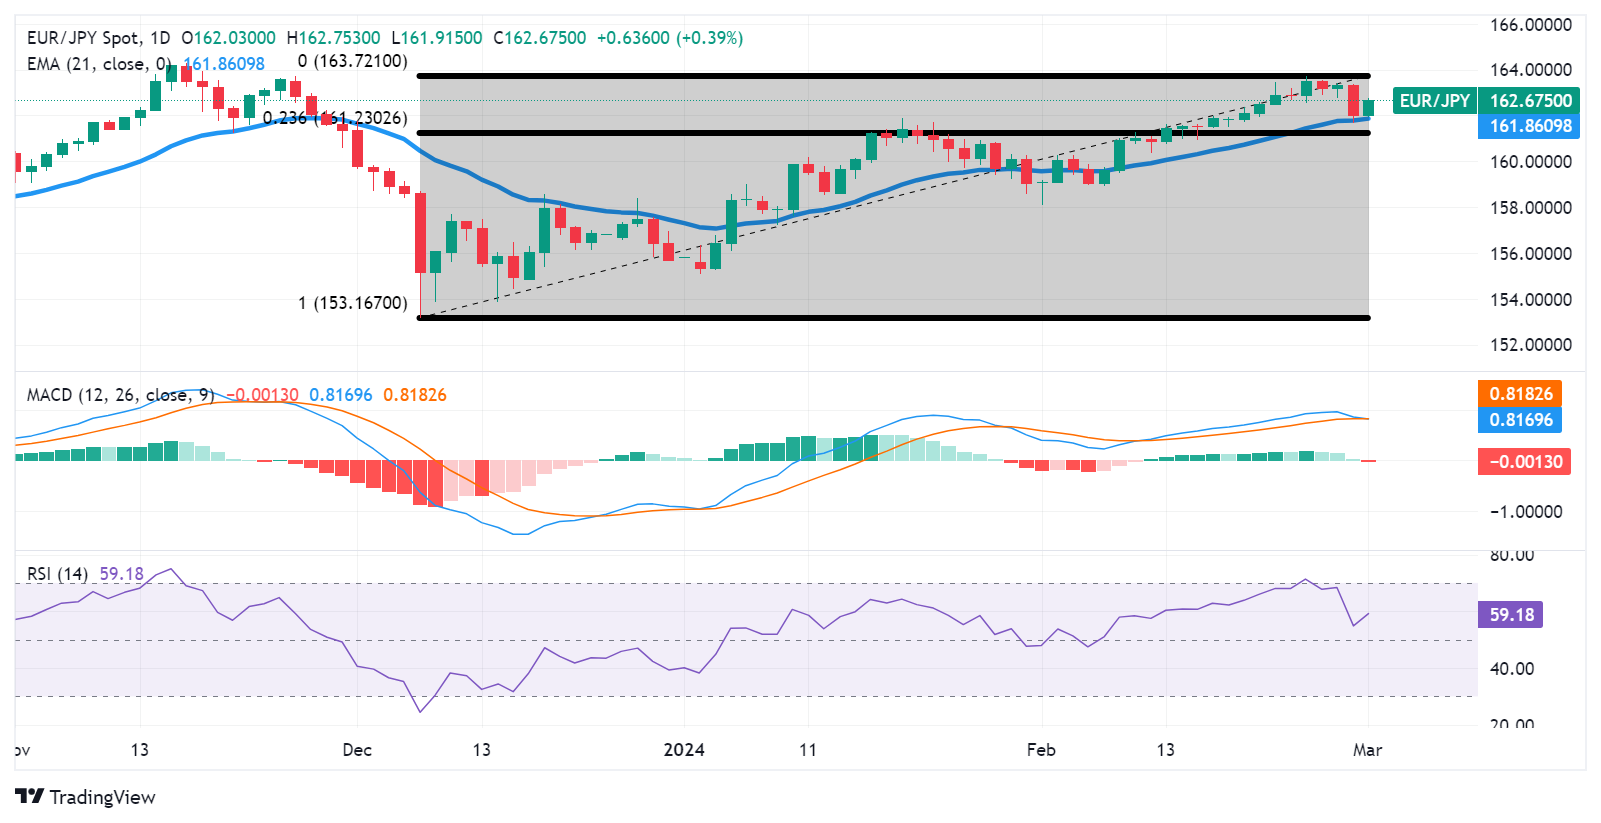
EUR/JPY retraces its recent losses, trading higher around 162.70 during the Asian session on Friday, following the psychological barrier of 163.00 level. A breakthrough above this barrier could lead the cross to explore the further resistance zone around the major level of 163.50 followed by February’s high at 163.72.

Technical analysis indicates a bullish sentiment for the EUR/JPY cross. The 14-day Relative Strength Index (RSI) is positioned above the 50 mark, signaling strength in the upward momentum.

However, the Moving Average Convergence Divergence (MACD) line is aligned with the signal line, indicating a convergence, while remaining above the centerline. Although the MACD is a lagging indicator, this configuration suggests a subdued momentum for the EUR/JPY cross at the moment.

On the downside, the EUR/JPY cross may encounter immediate support at the major level of 162.50, followed by the psychological level of 162.00. A breach below this support level could exert downward pressure on the pair, potentially testing the 21-day Exponential Moving Average (EMA) at 161.86.

Additionally, a further support zone for the EUR/JPY cross is anticipated around the major level of 161.50, with another significant support level near the 23.6% Fibonacci retracement level at 161.23.

EUR/JPY: Daily Chart


Disclaimer: For information purposes only. Past performance is not indicative of future results.
placeholder
Gold edges toward $4,200 as shutdown deal fuels aggressive December Fed cut betsGold trades near $4,195 in early Asian dealings, brushing up against the $4,200 mark as hopes for a U.S. shutdown-ending funding bill and a nearly 64% market-implied chance of a December Fed rate cut support XAU/USD, even as a divided Federal Reserve and upcoming policymaker speeches threaten to steady the dollar and cap bullion’s latest advance.
Author  Mitrade
22 hours ago
Gold trades near $4,195 in early Asian dealings, brushing up against the $4,200 mark as hopes for a U.S. shutdown-ending funding bill and a nearly 64% market-implied chance of a December Fed rate cut support XAU/USD, even as a divided Federal Reserve and upcoming policymaker speeches threaten to steady the dollar and cap bullion’s latest advance.
placeholder
Why a Quiet 2025 Signals a Massive 2026 Crypto Bull Run: Bitwise CIO ExplainsBitwise's Matt Hougan Predicts a Crypto Boom in 2026 Amid Current Market Struggles
Author  Mitrade
Yesterday 04: 03
Bitwise's Matt Hougan Predicts a Crypto Boom in 2026 Amid Current Market Struggles
placeholder
Gold hits three-week top as dovish Fed bets offset US government reopening optimismGold (XAU/USD) reverses a modest Asian session dip and climbs to an over three-week high, around the $4,213 region, on Thursday.
Author  FXStreet
Yesterday 06: 22
Gold (XAU/USD) reverses a modest Asian session dip and climbs to an over three-week high, around the $4,213 region, on Thursday.
placeholder
Bitcoin vs. Ethereum: Distinct Monetary UniversesBitcoin and Ethereum are diverging significantly in their monetary roles, according to a joint report from Glassnode and Keyrock.
Author  Mitrade
3 hours ago
Bitcoin and Ethereum are diverging significantly in their monetary roles, according to a joint report from Glassnode and Keyrock.
placeholder
Ethereum slides 5% as bears lean on $3,500 cap and put $3,150 support in focusEthereum (ETH) drops more than 5% after a failed push above $3,550, with price sliding to $3,153 and now holding below $3,350, the 100-hour SMA and a bearish trend line at $3,500; unless bulls reclaim the $3,350–$3,500 zone, the short-term bias stays bearish and a clean break under $3,150 could expose $3,050, $3,000 and even the $2,880–$2,850 support area.
Author  Mitrade
2 hours ago
Ethereum (ETH) drops more than 5% after a failed push above $3,550, with price sliding to $3,153 and now holding below $3,350, the 100-hour SMA and a bearish trend line at $3,500; unless bulls reclaim the $3,350–$3,500 zone, the short-term bias stays bearish and a clean break under $3,150 could expose $3,050, $3,000 and even the $2,880–$2,850 support area.
Related Instrument
goTop
quote