

AUD/USD dips on risk-off mood, RBNZ's dovish pivot

Source Fxstreet
  • AUD/USD falls 0.73% as RBNZ's cautious rate decision overshadows Australia's inflation report.
  • US economic data reveals growth, with GDP at 3.2% YoY, influencing global market sentiment.
  • Upcoming Australian Retail Sales expected to show recovery, with market forecasting a 1.5% rise MoM.

The Australian Dollar (AUD) dropped 0.73%, against the US Dollar (USD) on Wednesday/s session, courtesy of a dovish hold by the Reserve Bank of New Zealand (RBNZ), which followed a solid inflation report from Australia. As the Asian session begins, the AUD/USD trades at 0.6496, virtually unchanged.

AUD/USD retreats as investors weigh RBNZ's rate hold and anticipate Australian retail sales data

Wall Street finished with losses, as depicted by the S&P 500, down 0.30%. Economic data from the United States (US) showed the US economy is growing above the trend needed to drive inflation toward the US Federal Reserve's 2% target. the Gross Domestic Product (GDP) for the last quarter of 2023 grew by 3.2% YoY, below estimates of 3.3% and Q3 4.9%.

Besides that, Fed speakers stuck to their cautious stance, with Boston Fed President Susan Collins and New York Fed President John Williams supporting rate cuts later in the year. Collins noted that the road to achieving the inflation target would be “bumpy,” Williams said, “We still have a ways to go on the journey to sustained 2% inflation.”

Aside from this, Australian inflation data adopted a back seat as the RBNZ grabbed the attention with its decision to hold rates at 5.50% while removing hawkish comments from the monetary policy statement. AUD/USD and NZD/USD traders gathered more signals from RBNZ Governor Adrian Orr's Q&A session. He said there were discussions about a rate hike. Still, the strong consensus aimed to keep the current level of tightening, adding that some variables revealed that monetary policy is working.

What to watch?

Ahead of the Asian session, the Aussie’s economic docket will feature Retail Sales data, with the consensus expecting a jump from -2.7% to 1.5% MoM in January.

AUD/USD Price Analysis: Technical outlook

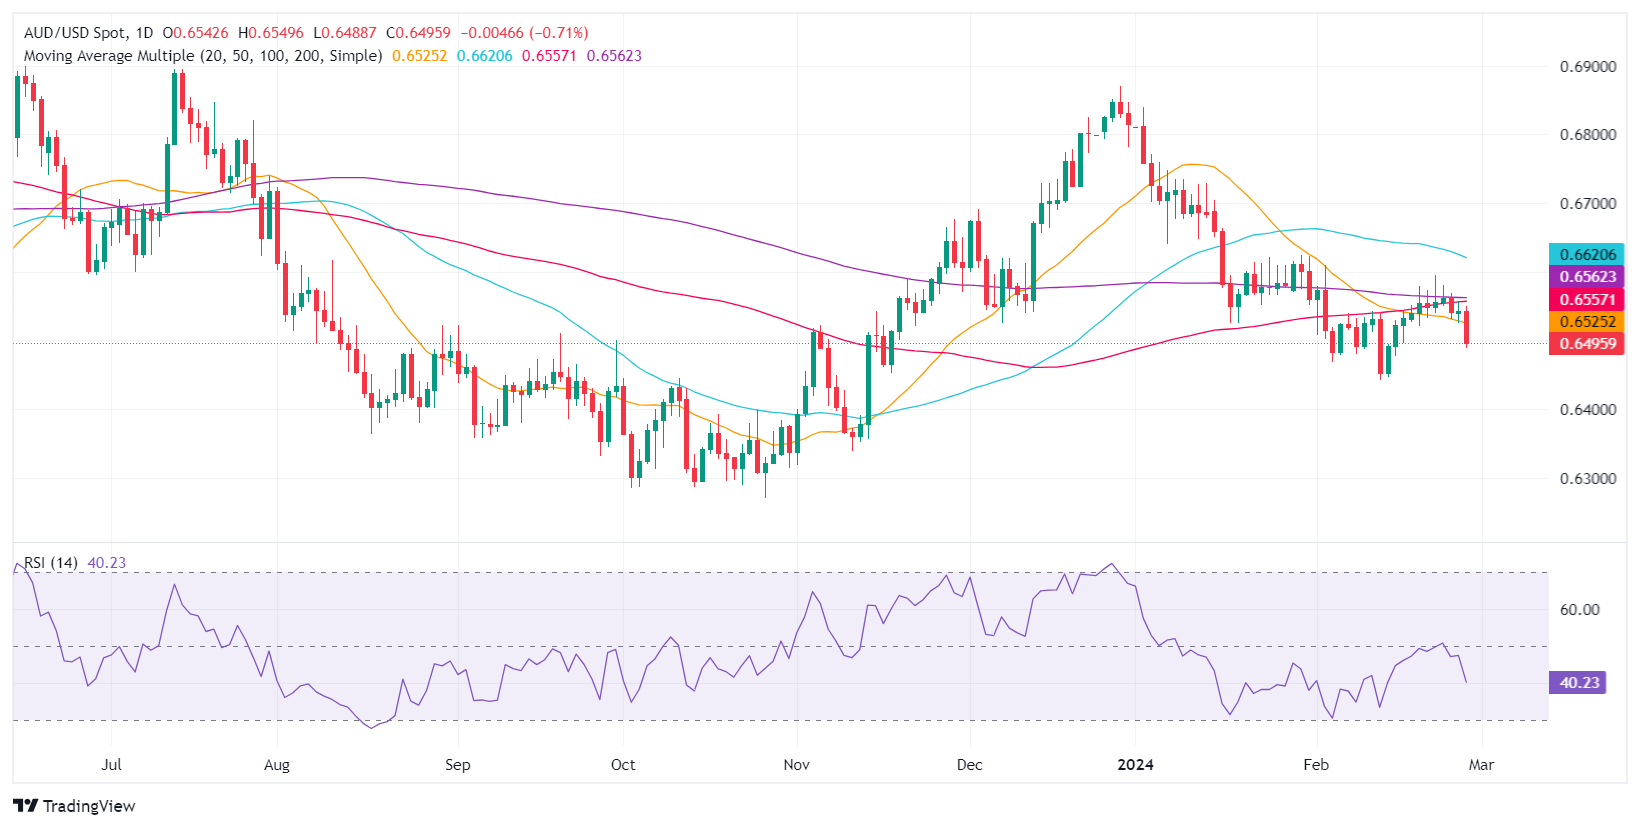
The AUD/USD pair shifted bearish bias after hovering around a narrow range of 0.6520-0.6580 and failing to crack the 200-day Moving Average (DMA) at 0.6559. that, along with fundamental reasons, pushed the spot price below the 0.6500 figure and extended its losses to a 9-day low. A fall below that area would expose the February 13 low of 0.6442, which, once cleared, could pave the way to test 0.6400. Conversely, if buyers reclaim 0.6500, they must regain the 100-DMA at 0.6533.
 

Disclaimer: For information purposes only. Past performance is not indicative of future results.
placeholder
Silver Price Forecast: XAG/USD falls to near $63.50 amid Fed hike bets, higher oil pricesSilver price (XAG/USD) loses its gains from the previous day, trading around $63.50 per troy ounce during Asian hours on Monday. Non-yielding Silver is currently facing significant headwinds driven by rising Federal Reserve (Fed) rate-hike expectations for the upcoming September decision.
Author  FXStreet
6 hours ago
Silver price (XAG/USD) loses its gains from the previous day, trading around $63.50 per troy ounce during Asian hours on Monday. Non-yielding Silver is currently facing significant headwinds driven by rising Federal Reserve (Fed) rate-hike expectations for the upcoming September decision.
placeholder
Fed hike odds near 90% into Wednesday's decision — how to trade the dollar, gold and the S&P 500A 0.3% monthly core CPI print has lifted the market-implied probability of a 25bp Fed hike on 16 September to roughly 86.5% ~ 90%, which would be the first increase since July 2023. Here is the decision timeline, the pricing versus the forecasts, both scenarios, and the key levels for the dollar, gold and the S&P 500.
Author  Suzie
9 hours ago
A 0.3% monthly core CPI print has lifted the market-implied probability of a 25bp Fed hike on 16 September to roughly 86.5% ~ 90%, which would be the first increase since July 2023. Here is the decision timeline, the pricing versus the forecasts, both scenarios, and the key levels for the dollar, gold and the S&P 500.
placeholder
Brent tests $108 as a key export pipeline stays shut — can the rally clear $110?Brent crude rose 2.55% to $106.97 and WTI 2.32% to $102.30 as a major regional export pipeline remained offline with no restart timeline. Front-month backwardation has widened to $5.53 from $3.84 a week ago, European gas is at its highest since December 2022, and one analyst sees $119.48 if talks stall.
Author  Irene Q.
10 hours ago
Brent crude rose 2.55% to $106.97 and WTI 2.32% to $102.30 as a major regional export pipeline remained offline with no restart timeline. Front-month backwardation has widened to $5.53 from $3.84 a week ago, European gas is at its highest since December 2022, and one analyst sees $119.48 if talks stall.
placeholder
TradingKey Daily Market Briefing: CPI Data Boosts Rate Hike Expectations, Geopolitical Risks Spark Oil Price SurgeTracking Market TrendsTradingKey - The three major U.S. stock indices rose across the board last Friday, with the Dow Jones Industrial Average rising 0.98%, the Nasdaq Composite Index gaining 0.96%, a
Author  TradingKey
16 hours ago
Tracking Market TrendsTradingKey - The three major U.S. stock indices rose across the board last Friday, with the Dow Jones Industrial Average rising 0.98%, the Nasdaq Composite Index gaining 0.96%, a
placeholder
Gold Price Forecast: PPI and Oil Prices Fuel Inflation Concerns, Can CPI Change Gold's Direction?As of the Asian session on September 11, gold prices (XAUUSD) remained in weak consolidation today after dropping sharply to near $4,300 on Thursday, with the latest price trading around
Author  TradingKey
Sep 11, Fri
As of the Asian session on September 11, gold prices (XAUUSD) remained in weak consolidation today after dropping sharply to near $4,300 on Thursday, with the latest price trading around
Related Instrument
goTop
quote