NZD/JPY bears step in after RBNZ dovish hold

Source Fxstreet
  • The NZD/JPY is currently trading at 91.84, registering a significant drop of 1% in Wednesday's session.
  • The RBNZ's dovish hold during the Asian session significantly weakened the NZD.
  • The daily RSI indicates a possible shift in momentum, with NZD/JPY buyer strength declining from the overbought territory near 50..
  • A short-term advantage for sellers is evident, with hourly RSI values oscillating near oversold territory.

In Wednesday's session, the NZD/JPY dived towards the 91.84 level, recording a notable decline of 1%. The main driver of this movement was the dovish decision from the Reserve Bank of New Zealand (RBNZ) which contributed to the Kiwi being the weakest currency in the session.

The RBNZ held the rates steady at 5.5%, with a revised outlook reducing the likelihood of another 25 bps hike from 75% to 40%. In addition, the bank cut down near-term Gross Domestic Product (GDP) growth projections, slightly adjusting inflation projections downwards. It expects, however, that inflation will return to the 1-3% target band in Q3 2025, implying the persistence of a tighter monetary policy. As a reaction, the combination of projections of a weaker economic activity with expectations of fewer hikes drove the Kiwi’s selloff.

NZD/JPY technical analysis

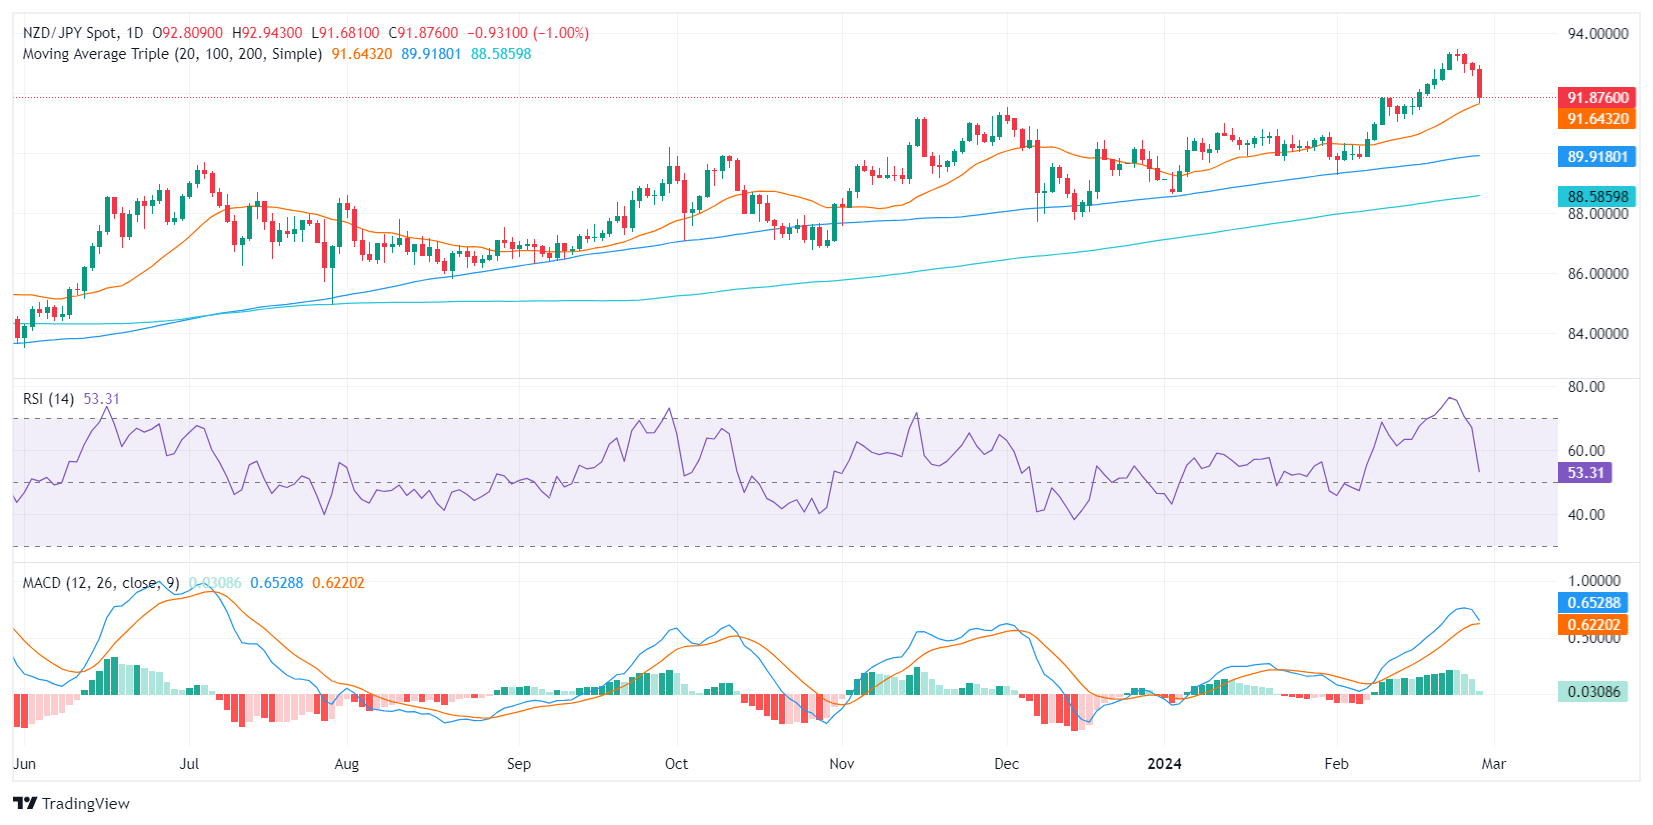
The daily Relative Strength Index (RSI) recently slid from the overbought territory and took a big hit in Wednesday’s session. This signals a potential turnaround moment, although the pair maintains a positive outlook within the broader technical landscape, as affirmed by its position above the 20,100,200-day Simple Moving Averages (SMAs). At the same time, the MACD histogram indicated a drop in bullish momentum, as marked by the shrinking green bars.

NZD/JPY daily chart

Interestingly, the hourly RSI values are oscillating within the negative territory, pointing to a short-term advantage for the sellers. Simultaneously, the MACD histogram on the hourly chart suggests the return of bullish momentum, as evidenced by the rising green bars. This hourly divergence hints at some level of intraday volatility for the NZD/JPY pair as indicators seem to be correcting oversold conditions.

NZD/JPY hourly chart
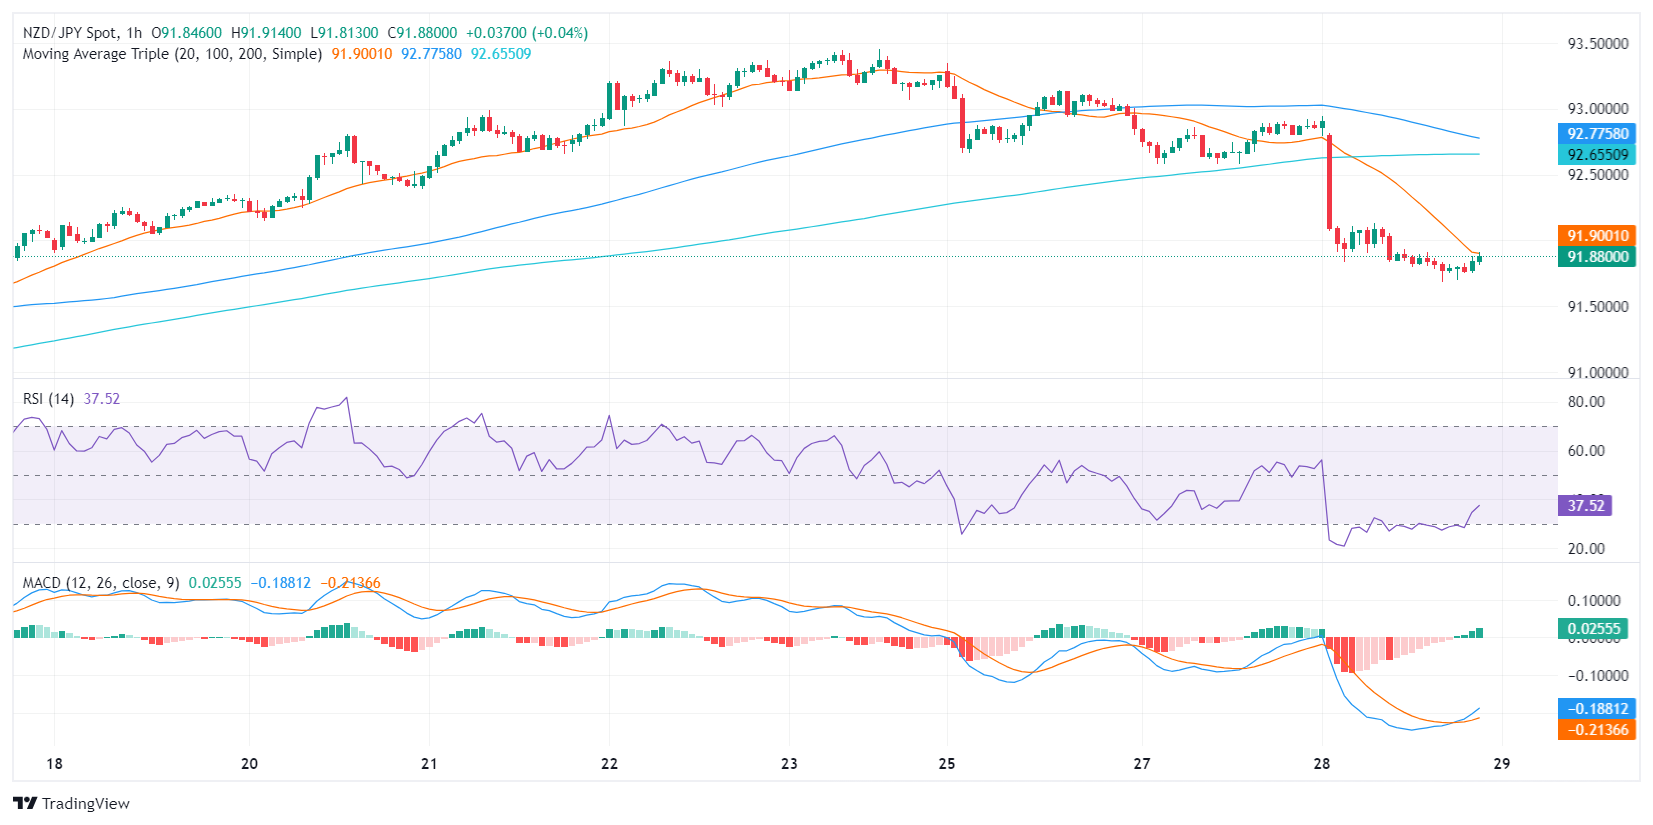
 

Disclaimer: For information purposes only. Past performance is not indicative of future results.
placeholder
US Q4 Earnings Season Set to Begin: Can US December CPI Data Bolster Rate Cut Case? [Weekly Preview]U.S. stocks kicked off 2026 with a rally as the market bets on economic growth and remains optimistic that the Federal Reserve will further cut interest rates this year. The fourth-quarte
Author  TradingKey
5 hours ago
U.S. stocks kicked off 2026 with a rally as the market bets on economic growth and remains optimistic that the Federal Reserve will further cut interest rates this year. The fourth-quarte
placeholder
Solana Future: From high-speed experiment to corporate treasury playbook for the next SOL cycleSolana’s Proof of History architecture is colliding with rising institutional treasury adoption and governance scrutiny, with SOL’s next cycle hinging on validator distribution, stability, and regulated capital access.
Author  Mitrade
8 hours ago
Solana’s Proof of History architecture is colliding with rising institutional treasury adoption and governance scrutiny, with SOL’s next cycle hinging on validator distribution, stability, and regulated capital access.
placeholder
WTI maintains position above $59.00 as supply risks growWest Texas Intermediate (WTI) Oil price extends its gains for the third successive session, trading around $59.10 per barrel during the Asian hours on Monday. Crude Oil prices rise as supply risks grow amid escalating protests in Iran.
Author  FXStreet
9 hours ago
West Texas Intermediate (WTI) Oil price extends its gains for the third successive session, trading around $59.10 per barrel during the Asian hours on Monday. Crude Oil prices rise as supply risks grow amid escalating protests in Iran.
placeholder
Trump’s Tariff Ruling Lands Today: Market to Rise or Fall — The Decision Will TellGlobal financial markets demonstrated strong performance at the beginning of 2026, fostering an optimistic atmosphere for early-year trading; however, this upward trend may face its first
Author  TradingKey
Jan 09, Fri
Global financial markets demonstrated strong performance at the beginning of 2026, fostering an optimistic atmosphere for early-year trading; however, this upward trend may face its first
placeholder
Top 3 Price Prediction: Bitcoin, Ethereum, Ripple — BTC, ETH and XRP defend key support as rebound scenario stays in playBTC holds above $90,000, ETH hovers near $3,128 at the 50-day EMA, and XRP steadies above $2.07 as traders weigh rebound targets and key downside levels.
Author  Mitrade
Jan 09, Fri
BTC holds above $90,000, ETH hovers near $3,128 at the 50-day EMA, and XRP steadies above $2.07 as traders weigh rebound targets and key downside levels.
Related Instrument
goTop
quote