USD/CHF Price Analysis: Trades back and forth around 0.8800

Source Fxstreet
  • USD/CHF trades sideways near 0.8800 as the focus shifts to US economic data.
  • The Swiss economy is expected to have growth at a moderate pace of 0.1% in the last quarter of 2023.
  • Fed policymakers support holding interest rates unchanged in the range of 5.25%-5.50%.

The USD/CHF is stuck in a tight range near the round-level resistance of 0.8800 since Friday’s trading session. The Swiss Franc asset struggles to find a direction as investors await the United States core Personal Consumption Expenditure price index (PCE) and Swiss Q4 Gross Domestic Product (GDP) data for further guidance.

The US Dollar edges down in Tuesday’s trading session. Further action in the US Dollar will be guided by the US core PCE price index data, which will influence market expectations for the Federal Reserve’s (Fed) rate cuts.

Meanwhile, Fed policymakers argue in favor of holding interest rates unchanged in the range of 5.25%-5.50% until they get evidence that inflation will fall sustainably to the required rate of 2%.

On the Swiss front, investors await the Q4 GDP data, which will be published on Thursday. Investors anticipate the economy grew modestly by 0.1% in the October-December quarter against 0.3% in the third quarter of 2023.

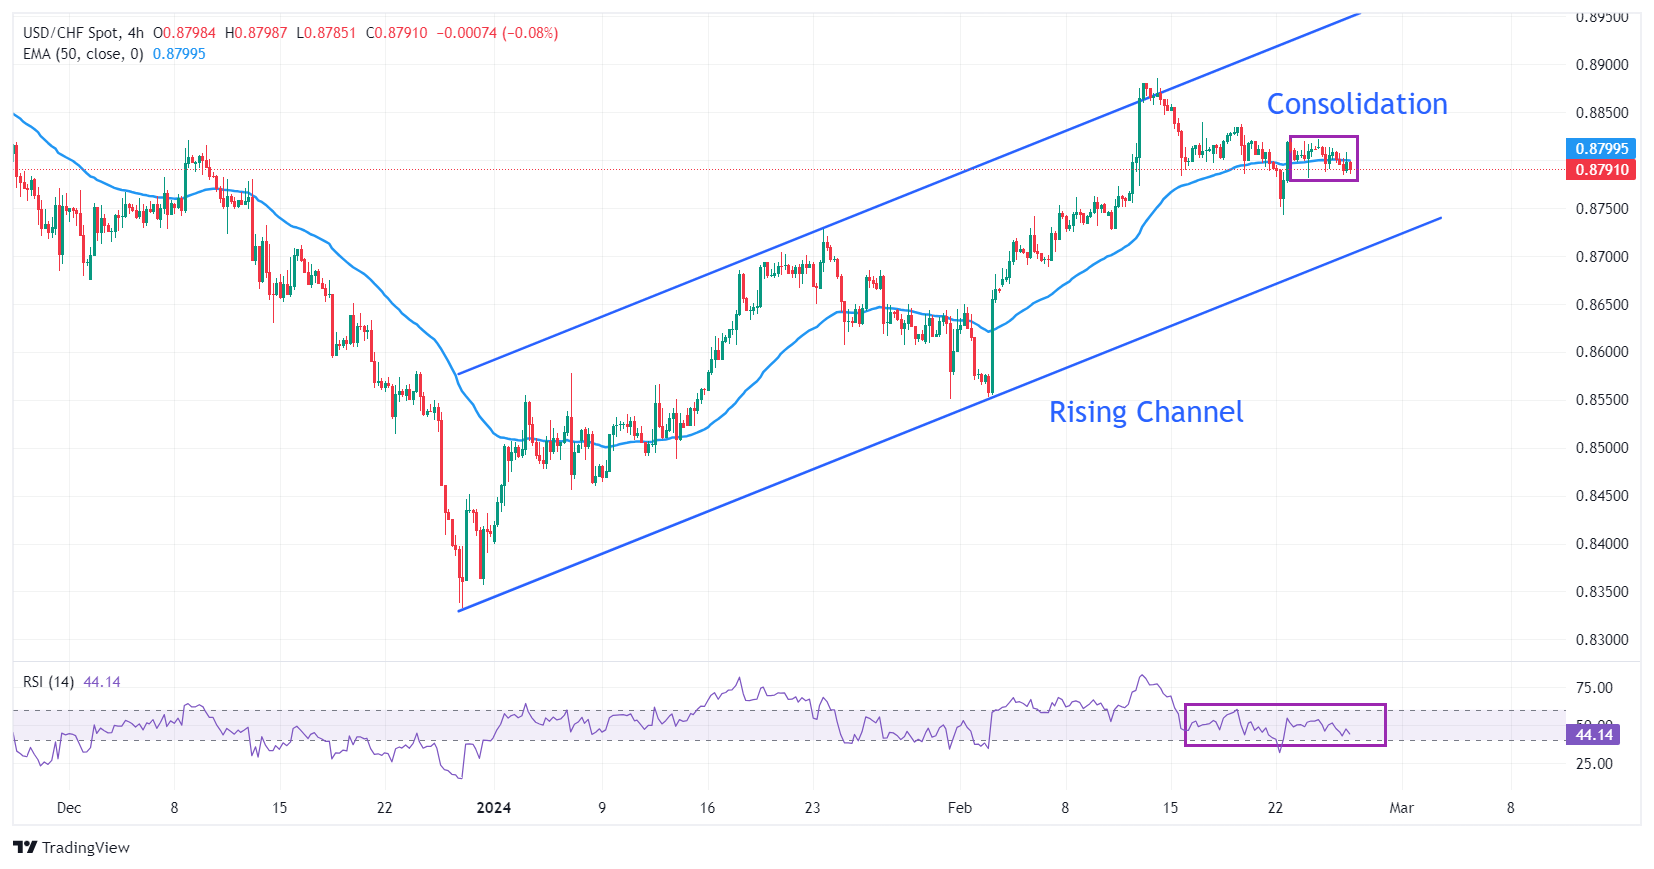
USD/CHF consolidates in a narrow range around 0.8800. The broader outlook remains bullish as the pair trades in a Rising Channel chart pattern formed on a four-hour timeframe. In the aforementioned chart pattern, market participants consider each pullback a buying opportunity.       

The 50-period Exponential Moving Average (EMA) at 0.8800 remains sticky with spot prices, indicating a sideways trend.

The 14-period Relative Strength Index (RSI) oscillates in the 40.00-60.00 range, demonstrating a sharp volatility contraction.

Fresh upside would emerge if the asset breaks above the three-month high of around 0.8886, which would unlock upside towards the September 20 low at 0.8932 and the November 8 low at 0.8976.

On the contrary, a breakdown below February 13 low at 0.8746 would expose the asset to round-level support of 0.8700, followed by February 1 high around 0.8650.

USD/CHF four-hour chart
 

Disclaimer: For information purposes only. Past performance is not indicative of future results.
placeholder
Gold Price Forecast: XAU/USD declines below $4,050 on USD strength and hawkish Fed comments Gold price (XAU/USD) extends the decline to around $4,030 during the early Asian session on Tuesday. The precious metal edges lower as traders dialed back expectations of a US interest rate cut next month.
Author  FXStreet
Nov 18, Tue
Gold price (XAU/USD) extends the decline to around $4,030 during the early Asian session on Tuesday. The precious metal edges lower as traders dialed back expectations of a US interest rate cut next month.
placeholder
Top 3 Price Prediction: Bitcoin, Ethereum, Ripple – BTC, ETH and XRP Look for a Foothold After a Sharp ShakeoutBitcoin trades near $92,600 after a dip below $90,000, while Ethereum around $3,118 and XRP near $2.21–$2.23 sit on key support zones, as BTC, ETH and XRP all try to turn a sharp correction into a tradable rebound rather than a deeper slide.
Author  Mitrade
Nov 19, Wed
Bitcoin trades near $92,600 after a dip below $90,000, while Ethereum around $3,118 and XRP near $2.21–$2.23 sit on key support zones, as BTC, ETH and XRP all try to turn a sharp correction into a tradable rebound rather than a deeper slide.
placeholder
Could XRP Really Catch Ethereum? Analysts Revisit the Question as ETF Tailwinds BuildAs US spot XRP ETFs roll out and issuers like Canary Capital and Franklin Templeton step in, analysts say XRP’s market cap could climb on growing utility and ETF accumulation—but overtaking Ethereum’s $373 billion smart-contract powerhouse remains a long-shot, at least for now.
Author  Mitrade
Nov 20, Thu
As US spot XRP ETFs roll out and issuers like Canary Capital and Franklin Templeton step in, analysts say XRP’s market cap could climb on growing utility and ETF accumulation—but overtaking Ethereum’s $373 billion smart-contract powerhouse remains a long-shot, at least for now.
placeholder
Bitcoin's Drop to $86K Approaches 'Max Pain' Zone, Yet Presents Potential Buying OpportunityAnalysts identify the $84,000 to $73,000 range as Bitcoin's likely "max pain" territory where capitulation may occur.
Author  Mitrade
Yesterday 03: 35
Analysts identify the $84,000 to $73,000 range as Bitcoin's likely "max pain" territory where capitulation may occur.
placeholder
Market Meltdown: BTC, ETH, and XRP Capitulate as Bears Seize ControlBitcoin trades around $85,900 after breaking below $86,000, with Ethereum under $2,791 and XRP below $1.99 as BTC, ETH and XRP extend weekly losses of 8–10%, forcing traders to focus on supports at $85,000, $2,749 and $1.77 for clues on whether this sell-off has further to run.
Author  Mitrade
Yesterday 04: 15
Bitcoin trades around $85,900 after breaking below $86,000, with Ethereum under $2,791 and XRP below $1.99 as BTC, ETH and XRP extend weekly losses of 8–10%, forcing traders to focus on supports at $85,000, $2,749 and $1.77 for clues on whether this sell-off has further to run.
goTop
quote