NZD/USD Price Analysis: Holds near 0.5725 with short-term moving averages supporting bullish tilt

Source Fxstreet
  • NZD/USD was seen hovering around the 0.5725 area on Wednesday, showing mild losses within a narrow intraday range.
  • While oscillators show mixed signals, shorter-term moving averages lean bullish, keeping the upside potential intact.
  • Support aligns at 0.5722–0.5725 zone, while resistance caps upside around 0.5732–0.5740 levels.

The NZD/USD pair traded with limited traction during Wednesday’s session ahead of the Asian open, seen around the 0.5725 zone. Despite a mild decline on the day, the pair continues to hold in a tight range, consolidating recent gains while staying above key short-term support levels. Momentum remains mixed, yet the bullish structure still holds, supported by shorter-term trend indicators.

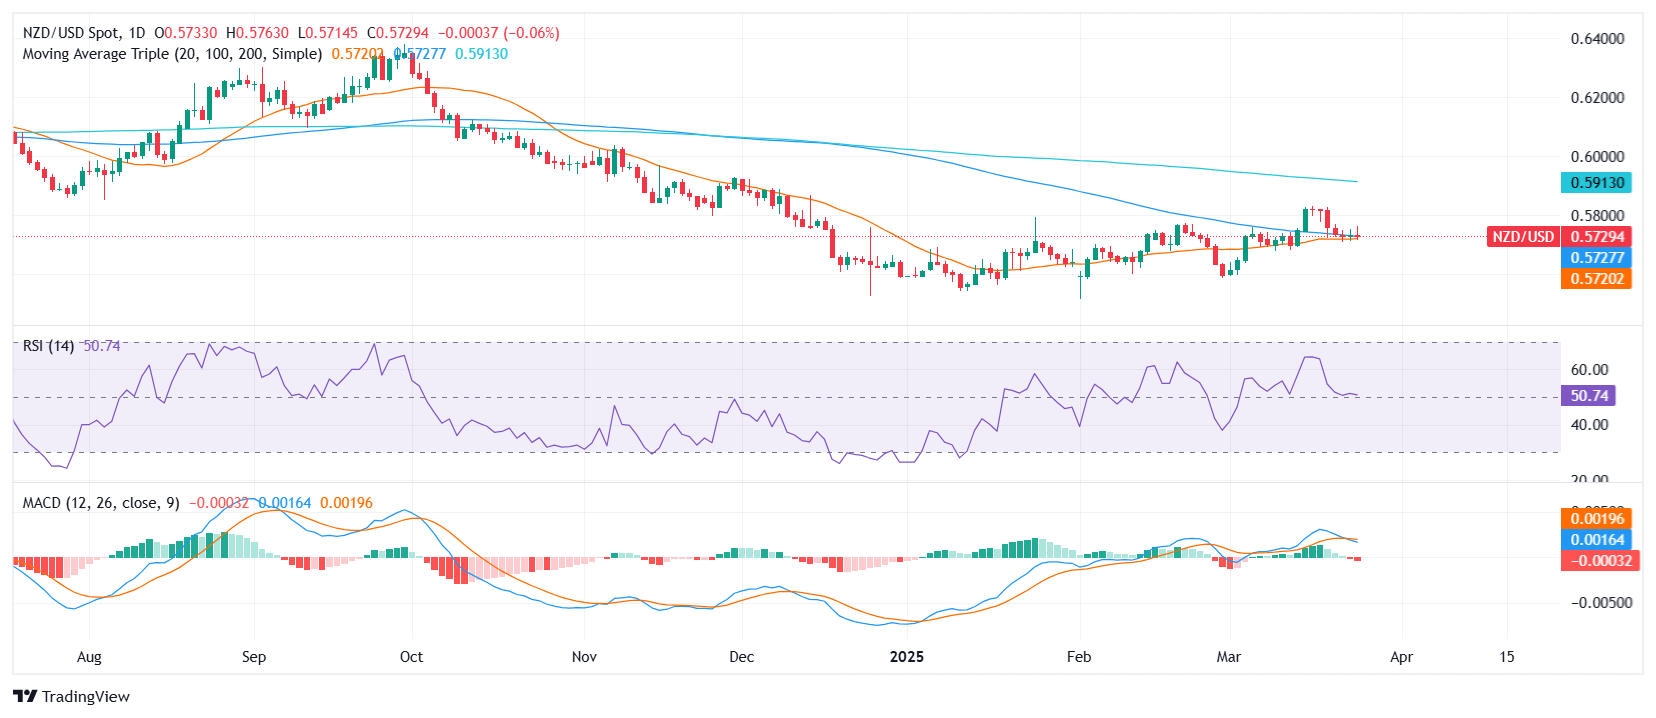
Technically, the Moving Average Convergence Divergence (MACD) signlas a mild bearish bias, while the Relative Strength Index (RSI) sits near 51, offering a neutral stance. The Bull Bear Power indicator, however, suggests latent buying interest. Meanwhile, the combined RSI/Stochastic oscillator also reads neutral, highlighting indecision in the momentum picture.

From a trend perspective, the 20-day Simple Moving Average at 0.5725 and both the 30-day EMA and SMA near 0.5723 continue to support short-term upside bias. However, traders should take note of the congestion between the 100-day and 20-day SMAs, currently at 0.5733 and 0.5720, respectively.

Support is stacked closely at 0.5725, 0.5723, and 0.5722, while resistance lies ahead at 0.5732, followed by 0.5740. A clean break above the latter may spark renewed interest toward higher levels, while failure to hold the support cluster could lead to short-term weakness.

NZD/USD daily chart
Disclaimer: For information purposes only. Past performance is not indicative of future results.
placeholder
Top 3 Price Prediction: Bitcoin, Ethereum, Ripple – BTC, ETH and XRP Look for a Foothold After a Sharp ShakeoutBitcoin trades near $92,600 after a dip below $90,000, while Ethereum around $3,118 and XRP near $2.21–$2.23 sit on key support zones, as BTC, ETH and XRP all try to turn a sharp correction into a tradable rebound rather than a deeper slide.
Author  Mitrade
Nov 19, Wed
Bitcoin trades near $92,600 after a dip below $90,000, while Ethereum around $3,118 and XRP near $2.21–$2.23 sit on key support zones, as BTC, ETH and XRP all try to turn a sharp correction into a tradable rebound rather than a deeper slide.
placeholder
Even As Bitcoin's Price Falls, Michael Saylor Feels 'Indestructible'The price of Bitcoin dipped below $89,000, setting a new weekly low as corporate buyer Strategy remains bullish.
Author  Mitrade
Yesterday 03: 08
The price of Bitcoin dipped below $89,000, setting a new weekly low as corporate buyer Strategy remains bullish.
placeholder
Could XRP Really Catch Ethereum? Analysts Revisit the Question as ETF Tailwinds BuildAs US spot XRP ETFs roll out and issuers like Canary Capital and Franklin Templeton step in, analysts say XRP’s market cap could climb on growing utility and ETF accumulation—but overtaking Ethereum’s $373 billion smart-contract powerhouse remains a long-shot, at least for now.
Author  Mitrade
Yesterday 03: 28
As US spot XRP ETFs roll out and issuers like Canary Capital and Franklin Templeton step in, analysts say XRP’s market cap could climb on growing utility and ETF accumulation—but overtaking Ethereum’s $373 billion smart-contract powerhouse remains a long-shot, at least for now.
placeholder
Bitcoin's Drop to $86K Approaches 'Max Pain' Zone, Yet Presents Potential Buying OpportunityAnalysts identify the $84,000 to $73,000 range as Bitcoin's likely "max pain" territory where capitulation may occur.
Author  Mitrade
11 hours ago
Analysts identify the $84,000 to $73,000 range as Bitcoin's likely "max pain" territory where capitulation may occur.
placeholder
Market Meltdown: BTC, ETH, and XRP Capitulate as Bears Seize ControlBitcoin trades around $85,900 after breaking below $86,000, with Ethereum under $2,791 and XRP below $1.99 as BTC, ETH and XRP extend weekly losses of 8–10%, forcing traders to focus on supports at $85,000, $2,749 and $1.77 for clues on whether this sell-off has further to run.
Author  Mitrade
10 hours ago
Bitcoin trades around $85,900 after breaking below $86,000, with Ethereum under $2,791 and XRP below $1.99 as BTC, ETH and XRP extend weekly losses of 8–10%, forcing traders to focus on supports at $85,000, $2,749 and $1.77 for clues on whether this sell-off has further to run.
goTop
quote