USD/CAD Price Analysis: Extends losses towards the major support at 1.3450

Source Fxstreet
  • USD/CAD could breach the major support at the 1.3450 level.
  • Technical indicators suggest a potential momentum shift towards a downward trend.
  • A break above 1.3500 could lead the pair to test the weekly high at 1.3536 and the major barrier at 1.3550.

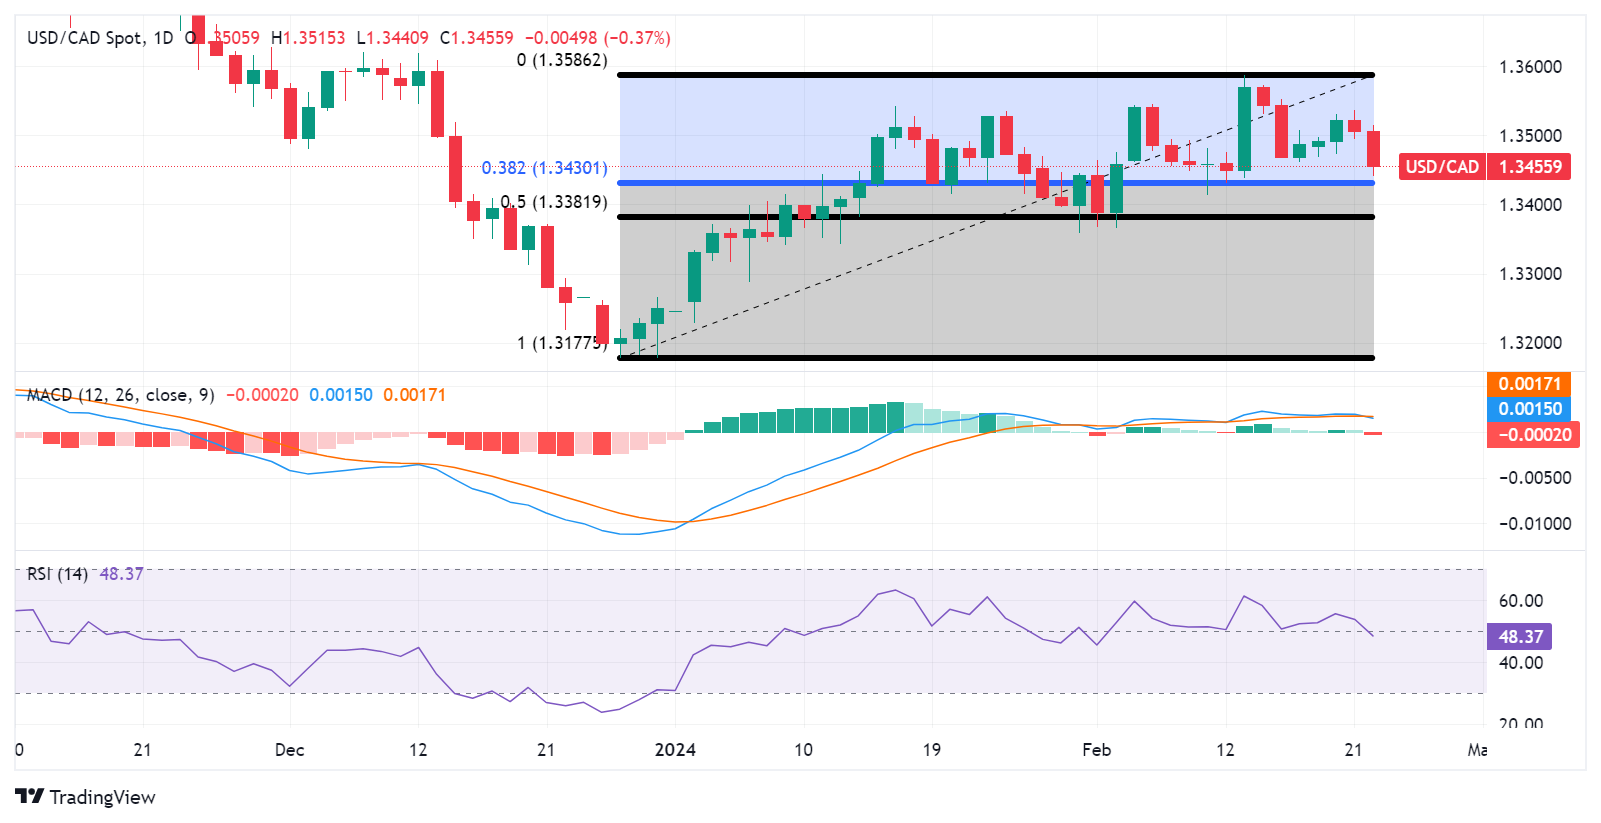
USD/CAD moves in a downward direction for the second consecutive day, trading around 1.3460 during the European session on Thursday. The pair is positioned just above the major support level of 1.3450. The technical analysis of the 14-day Relative Strength Index (RSI) is positioned below 50, suggesting bearish momentum for the USD/CAD pair.

A break below the major support could put downward pressure on the USD/CAD pair to test the support level of the 38.2% Fibonacci retracement level at 1.3430. If the pair breaches the latter, it could navigate the psychological support region at 1.3400 level followed by the 50.0% retracement level of 1.3381.

Additionally, the lagging indicator Moving Average Convergence Divergence (MACD) for the USD/CAD pair suggests a possible shift in momentum towards a downward trend in the market. This assessment is derived from the positioning of the MACD line above the centerline but below the signal line. Traders may opt to await clearer directional sentiment from the MACD indicator before making trading decisions.

On the upside, the USD/CAD pair may encounter significant resistance at the psychological level of 1.3500. A decisive breakthrough above this psychological resistance could generate positive sentiment, potentially propelling the pair to test the resistance zone around the weekly high at 1.3536 and the major barrier at 1.3550. Further upside momentum could see the pair approaching the February high at 1.3586.

USD/CAD: Daily Chart


Disclaimer: For information purposes only. Past performance is not indicative of future results.
placeholder
The 2026 Fed Consensus Debate: Not Hassett, It’s About Whether Powell Stays or GoesKevin Hassett, White House National Economic Council Director, is poised to succeed Jerome Powell as the next Federal Reserve Chair. This development signals a potentially more dovish mon
Author  TradingKey
11 hours ago
Kevin Hassett, White House National Economic Council Director, is poised to succeed Jerome Powell as the next Federal Reserve Chair. This development signals a potentially more dovish mon
placeholder
Avalanche Bulls Eye Trend Reversal, Though Muted Derivatives Signal CautionAvalanche (AVAX) consolidates above $14.00 after an 8% breakout, but with open interest below $600 million and key resistance at $17.14 looming, traders remain cautious.
Author  Mitrade
14 hours ago
Avalanche (AVAX) consolidates above $14.00 after an 8% breakout, but with open interest below $600 million and key resistance at $17.14 looming, traders remain cautious.
placeholder
Bitcoin Bollinger Bands indicate another 'parabolic' bull signal like late 2023Historical patterns indicate that low BandWidth levels often precede significant BTC price increases.
Author  Mitrade
15 hours ago
Historical patterns indicate that low BandWidth levels often precede significant BTC price increases.
placeholder
AUD/USD sticks to gains above 0.6600, highest since late October after Aussie trade dataThe AUD/USD pair prolongs its strong uptrend witnessed over the past two weeks or so and advances to a fresh high since late October during the Asian session on Thursday.
Author  FXStreet
20 hours ago
The AUD/USD pair prolongs its strong uptrend witnessed over the past two weeks or so and advances to a fresh high since late October during the Asian session on Thursday.
placeholder
Solana Price Forecast: ETF Demand and Derivatives Flows Fuel a Sharper ReboundSolana (SOL) trades above $140 after a 10% daily jump, as ETF inflows flip positive, futures open interest climbs 6.75% and on-chain TVL and stablecoin liquidity rise, setting up a potential double-bottom breakout toward the 50-day EMA at $158 if SOL can secure a daily close above $145.
Author  Mitrade
Yesterday 06: 36
Solana (SOL) trades above $140 after a 10% daily jump, as ETF inflows flip positive, futures open interest climbs 6.75% and on-chain TVL and stablecoin liquidity rise, setting up a potential double-bottom breakout toward the 50-day EMA at $158 if SOL can secure a daily close above $145.
goTop
quote