EUR/GBP gains momentum on quiet Monday, bulls step in

Source Fxstreet
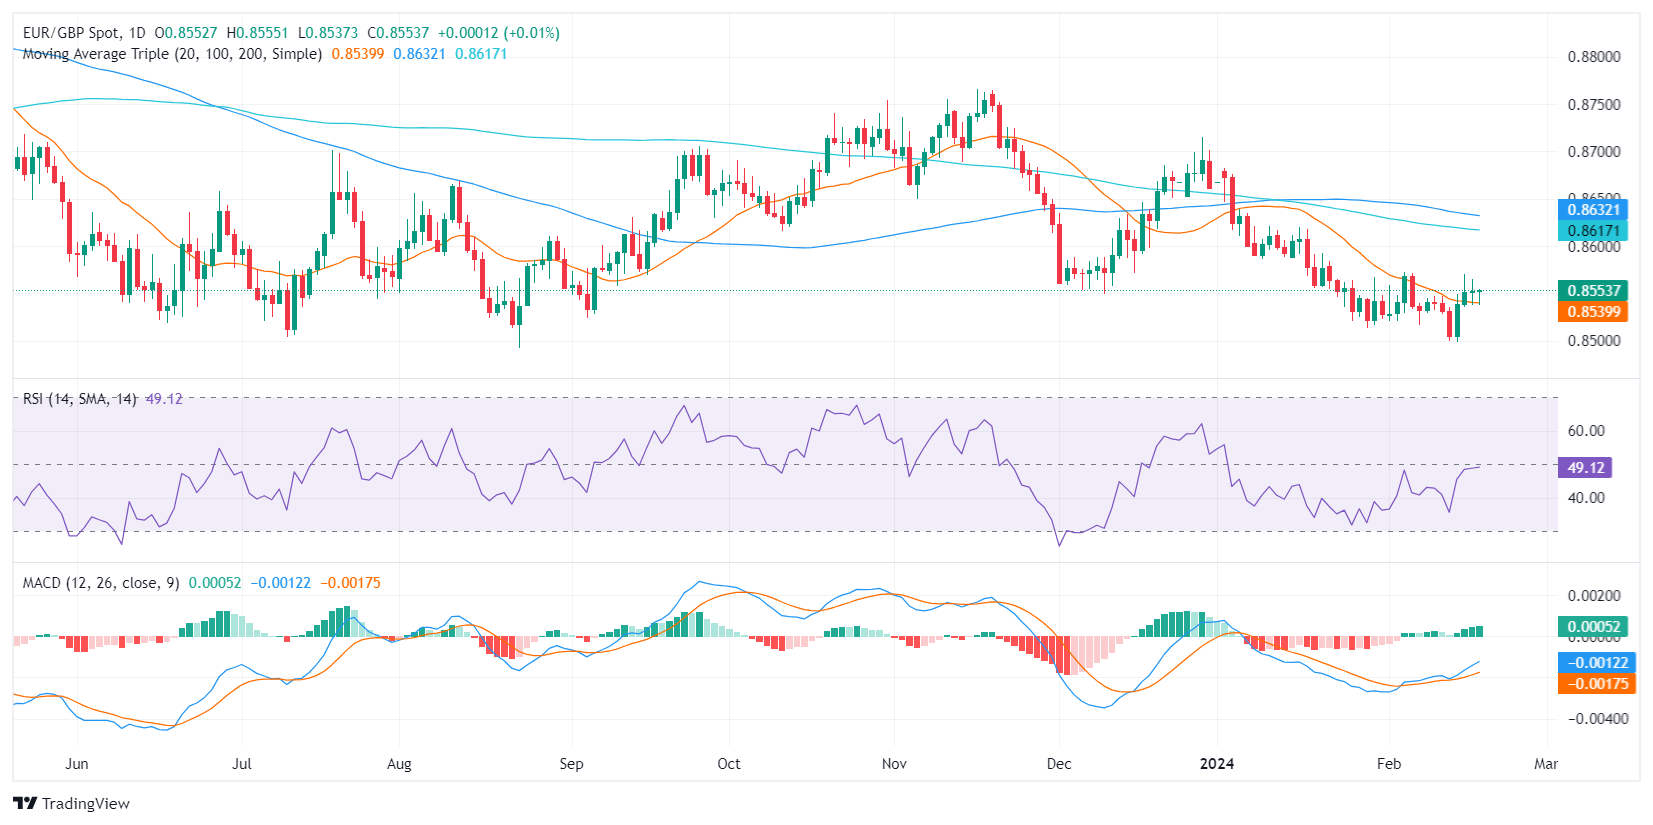
  • The EUR/GBP stands at 0.8555 in Monday's session, jumping above the 20-day SMA.
  • Sticky European inflation may push the ECB to a more aggressive stance toward the easing cycle.
  • The week’s highlight will be the British and the EU’s Manufacturing PMIs from February.
  • As long as markets bet on the BoE starting its easing later than the ECB the upside may be limited.

In Monday's session, the EUR/GBP was at 0.8555 amid anticipation of possible shifts in European Central Bank (ECB) policy, as recent indicators point towards revitalized wage growth and a surprising uptick in core inflation. However, markets are still betting on a sooner easing-cycle start than the Bank of England (BoE) which gives the Pound an advantage over the euro.

In the Euro area, the inflation trend reversed partially in January when core inflation was above expectations at 3.3%, indicative of a strengthening Eurozone economy. There is speculation that resilient wage growth, as suggested by the ECB’s wage tracker, may contribute to stickier inflation which may push the bank to hold rates for longer. In that sense, if the European economies show strengths as the British economy, the Euro could partially strengthen. However, markets are still betting between 125-100 bps of easing from the ECB in 2024, vs the sub-100 bps of cutting from the BoE which could limit the upside. Incoming data will set the timing of the easing, and this week, markets will get key Manufacturing PMI readings from both economic blocks from February which could ignite volatility in the pair.

EUR/GBP technical analysis

Examining the Relative Strength Index (RSI), the EUR/GBP pair hints at a slightly positive outlook as the index hovers around the central mark, indicating restrained buying momentum. Recent transitions further validate this tilt, with the RSI shifting from deep negative to the 50 mark, indicating a possible shift in buyer power. However, the shifting trend is not markedly aggressive, suggesting a scope for volatility.

On the other hand, the Moving Average Convergence Divergence (MACD) histogram, a measure to evaluate momentum, highlights green bars, which underscores growing buying momentum.

Finally, the pair's position against its Simple Moving Averages (SMAs) implies a mixed bias in the short term. Despite being above the 20-day SMA, the pair still lingers below the 100 and 200-day SMA, signaling a considerable bearish presence. Hence, for the upward momentum to persist, bulls must increase their efforts.

EUR/GBP daily chart


Disclaimer: For information purposes only. Past performance is not indicative of future results.
placeholder
Crypto Weekly Radar: All eyes on Donald Trump’s ultimatum, US macroeconomic dataCrypto markets begin the week with mixed sentiment, with Bitcoin (BTC) trading above $69,000 following last week’s rebound. Still, markets remain cautious as traders weigh risks stemming from Donald Trump’s renewed threats toward Iran ahead of the ultimatum set for Tuesday.
Author  FXStreet
7 hours ago
Crypto markets begin the week with mixed sentiment, with Bitcoin (BTC) trading above $69,000 following last week’s rebound. Still, markets remain cautious as traders weigh risks stemming from Donald Trump’s renewed threats toward Iran ahead of the ultimatum set for Tuesday.
placeholder
WTI eases below $103.50 as US, Iran reportedly seeking 45-day ceasefireWest Texas Intermediate (WTI), the US crude oil benchmark, is trading around $103.30 during the early European trading hours on Monday. The WTI price retreats after reports that the United States (US) and Iran are making a push for a 45-day ceasefire. 
Author  FXStreet
7 hours ago
West Texas Intermediate (WTI), the US crude oil benchmark, is trading around $103.30 during the early European trading hours on Monday. The WTI price retreats after reports that the United States (US) and Iran are making a push for a 45-day ceasefire. 
placeholder
Gold under pressure as fears mount, $4,600 support at risk Spot Gold gapped marginally lower at the weekly opening, with the XAU/USD pair battling to retain the $4,600 mark early in the Asian session.
Author  TradingKey
15 hours ago
Spot Gold gapped marginally lower at the weekly opening, with the XAU/USD pair battling to retain the $4,600 mark early in the Asian session.
placeholder
Gold Second-Quarter Outlook: Safe-Haven Failure or Pricing Logic Reshaping? Can Gold Enter a Major Rally?In the first quarter of 2026, gold prices experienced a classic "roller-coaster" ride. Against a macroeconomic backdrop of escalating geopolitical conflicts, gold prices briefly broke thr
Author  TradingKey
Apr 03, Fri
In the first quarter of 2026, gold prices experienced a classic "roller-coaster" ride. Against a macroeconomic backdrop of escalating geopolitical conflicts, gold prices briefly broke thr
placeholder
Spot Crude Oil Breaks $140. First Time Since 2008. Oil Market’s Most Severe Shock in History Is Here. On Thursday, April 2, Dated Brent crude prices reached $141.37 per barrel, the highest level since 2008, surpassing the peak set during the outbreak of the Russia-Ukraine conflict in 2022
Author  TradingKey
Apr 03, Fri
On Thursday, April 2, Dated Brent crude prices reached $141.37 per barrel, the highest level since 2008, surpassing the peak set during the outbreak of the Russia-Ukraine conflict in 2022
Related Instrument
goTop
quote