

AUD/USD Price Forecast: Remains confined in a familiar range below 0.6300 mark
- AUD/USD continues with its struggle to gain any meaningful traction on Tuesday.
- RBA rate cut bets, and US-China trade tensions cap the Aussie amid a stronger USD.
- Bulls await a sustained strength above the 0.6300 mark before placing fresh bets.
The AUD/USD pair extends its sideways consolidative price move for the fifth straight day and remains below the 0.6300 mark through the first half of the European session on Tuesday.
Against the backdrop of rising bets for an imminent rate cut by the Reserve Bank of Australia (RBA) next week, escalating US-China trade tensions turn out to be a key factor acting as a headwind for the Australian Dollar (AUD). Apart from this, a modest US Dollar (USD) strength, bolstered by expectations that US President Donald Trump's trade tariffs would boost inflation and force the Federal Reserve (Fed) to stick to its hawkish stance, contributes to capping the AUD/USD pair.
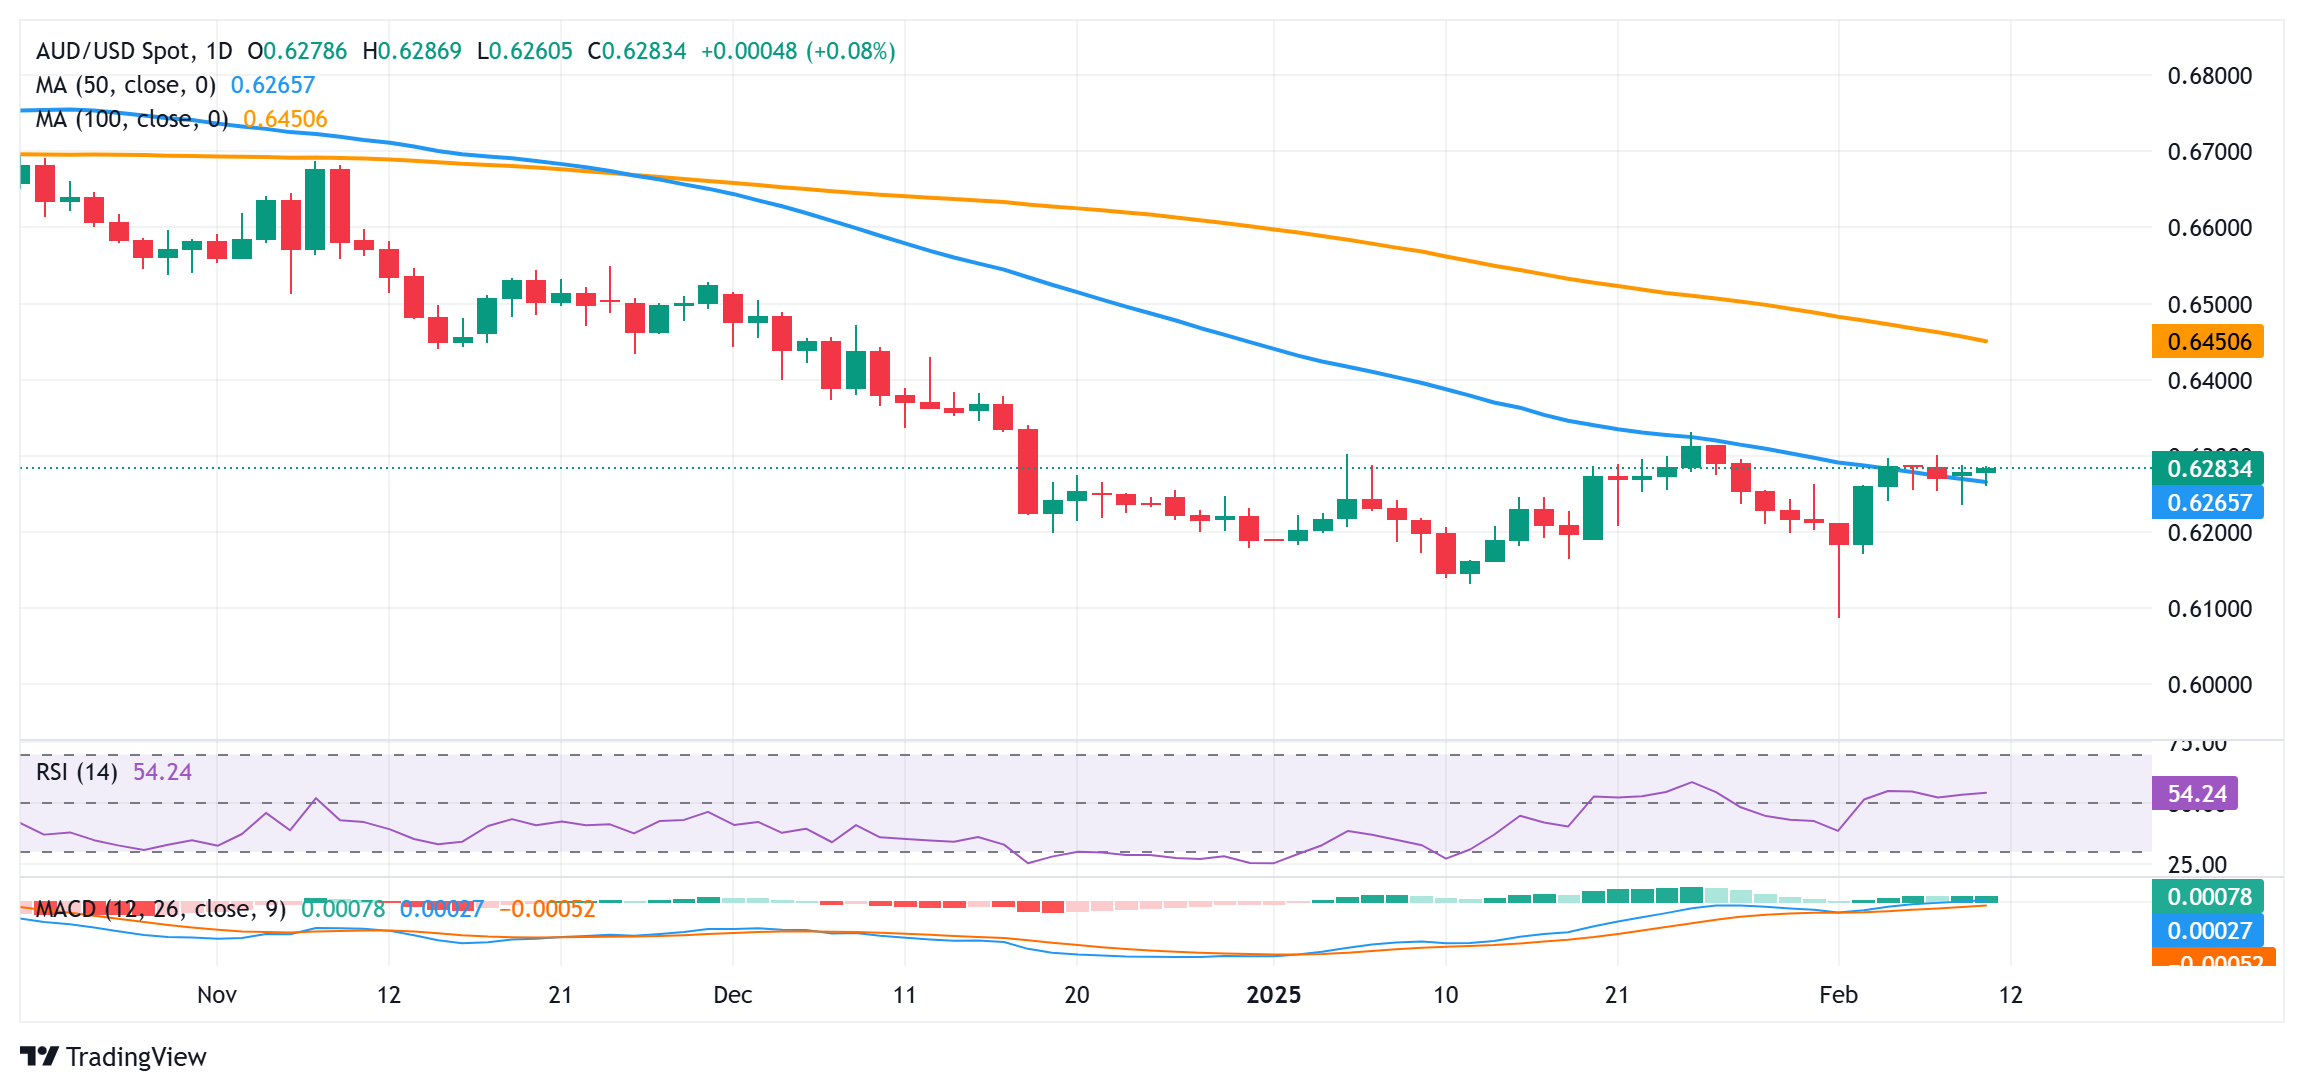
From a technical perspective, spot prices now seem to have found acceptance above the 50-day Simple Moving Average (SMA). Moreover, oscillators on the daily chart have just started gaining positive traction and suggest that the path of least resistance for the AUD/USD pair is to the upside. That said, it will be prudent to wait for a sustained strength above the 0.6300 mark before positioning for an extension of the recent recovery from the lowest level since April 2020 touched earlier this month.
The subsequent move-up could lift spot prices to the 0.6365-0.6370 intermediate hurdle en route to the 0.6400 mark and the 100-day SMA barrier, currently pegged near the 0.6455 region. Some follow-through buying beyond the latter will suggest that spot prices have bottomed out and pave the way for a further near-term appreciating move.
On the flip side, the overnight swing low, around the 0.6235 region, now seems to act as an immediate support, below which the AUD/USD pair could slide to sub-0.6200 levels. The downward trajectory could extend further towards the 0.6145-0.6140 area en route to the multi-year low, around the 0.6090-0.6085 region. Spot prices might eventually drop to the 0.6000 psychological mark before aiming to test the April 2020 swing low, around the 0.5980 zone.
AUD/USD daily chart
US-China Trade War FAQs
Generally speaking, a trade war is an economic conflict between two or more countries due to extreme protectionism on one end. It implies the creation of trade barriers, such as tariffs, which result in counter-barriers, escalating import costs, and hence the cost of living.
An economic conflict between the United States (US) and China began early in 2018, when President Donald Trump set trade barriers on China, claiming unfair commercial practices and intellectual property theft from the Asian giant. China took retaliatory action, imposing tariffs on multiple US goods, such as automobiles and soybeans. Tensions escalated until the two countries signed the US-China Phase One trade deal in January 2020. The agreement required structural reforms and other changes to China’s economic and trade regime and pretended to restore stability and trust between the two nations. However, the Coronavirus pandemic took the focus out of the conflict. Yet, it is worth mentioning that President Joe Biden, who took office after Trump, kept tariffs in place and even added some additional levies.
The return of Donald Trump to the White House as the 47th US President has sparked a fresh wave of tensions between the two countries. During the 2024 election campaign, Trump pledged to impose 60% tariffs on China once he returned to office, which he did on January 20, 2025. With Trump back, the US-China trade war is meant to resume where it was left, with tit-for-tat policies affecting the global economic landscape amid disruptions in global supply chains, resulting in a reduction in spending, particularly investment, and directly feeding into the Consumer Price Index inflation.
Recommended Articles


