

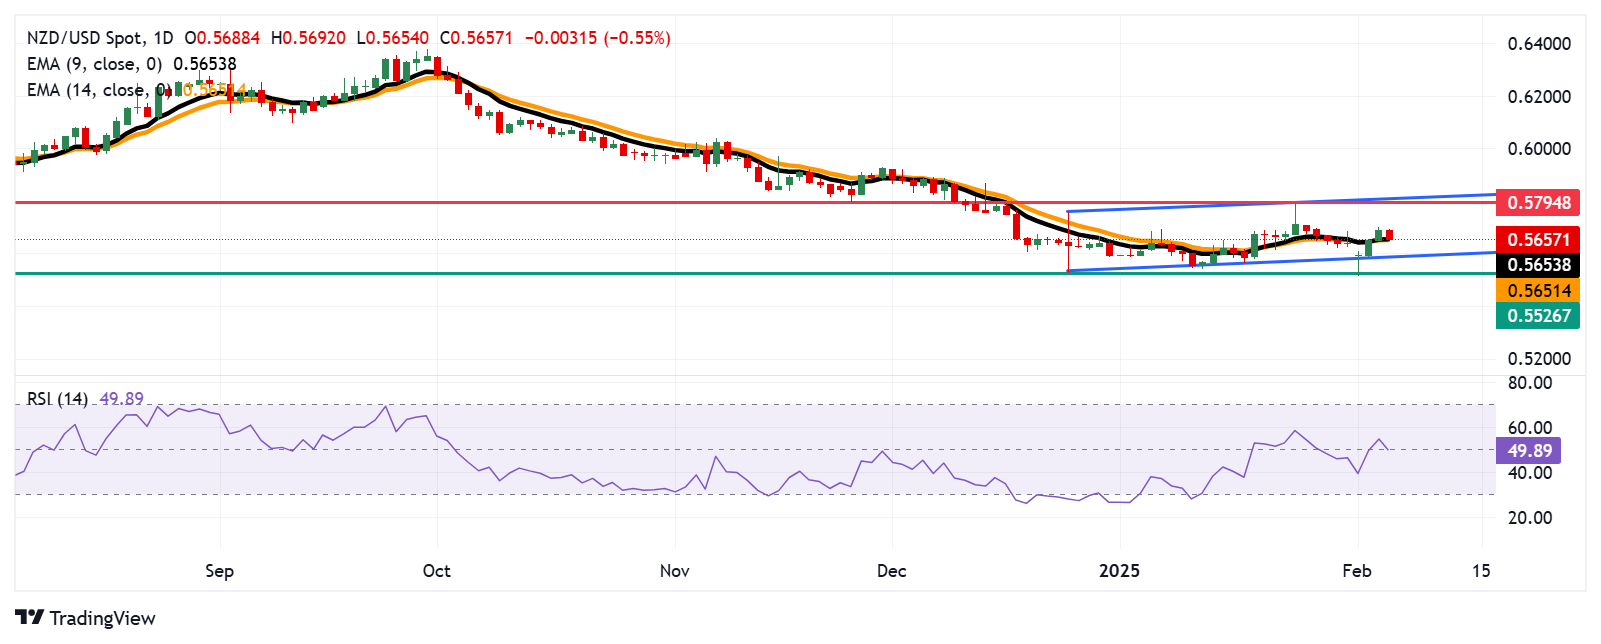
NZD/USD Price Forecast: Tests nine-day EMA near 0.5650; moves within a rectangular pattern
- NZD/USD tests the nine-day EMA at 0.5654, followed by the psychological level of 0.5650.
- The 14-day RSI is positioned at the 50 level, confirming an ongoing neutral bias.
- The key resistance zone appears at its eight-week high of 0.5794, followed by the psychological level of 0.5800.
The NZD/USD pair breaks its four-day winning streak, trading around 0.5660 during the European hours on Thursday. The technical analysis of the daily chart indicates that buyers and sellers are unsure of the long-term direction of the asset as the pair consolidates within a rectangular pattern.
Additionally, the 14-day Relative Strength Index (RSI) is positioned at the 50 level, confirming an ongoing neutral bias. However, the NZD/USD pair remains slightly above the nine-day Exponential Moving Average (EMA), reflecting that short-term price momentum still has some spark.
On the upside, the NZD/USD pair could navigate the area around its eight-week high of 0.5794, reached on January 24. The further barrier appears at the psychological level of 0.5800, aligned with the upper boundary of the rectangle at 0.5820.
Regarding its support, the NZD/USD pair tests immediate nine-day EMA at 0.5654, aligned with the psychological level of 0.5650. A break below this level could lead the pair to navigate the region around its support area at 0.5526—its lowest point since October 2022, reached on December 25. Further support appears near the lower edge of its descending channel at the 0.5500 level.
NZD/USD: Daily Chart
New Zealand Dollar PRICE Today
The table below shows the percentage change of New Zealand Dollar (NZD) against listed major currencies today. New Zealand Dollar was the weakest against the Japanese Yen.
| USD | EUR | GBP | JPY | CAD | AUD | NZD | CHF | |
|---|---|---|---|---|---|---|---|---|
| USD | 0.33% | 0.33% | -0.09% | 0.32% | 0.45% | 0.56% | 0.28% | |
| EUR | -0.33% | -0.01% | -0.41% | -0.01% | 0.12% | 0.24% | -0.07% | |
| GBP | -0.33% | 0.00% | -0.42% | 0.00% | 0.12% | 0.24% | -0.04% | |
| JPY | 0.09% | 0.41% | 0.42% | 0.42% | 0.54% | 0.62% | 0.37% | |
| CAD | -0.32% | 0.00% | -0.00% | -0.42% | 0.13% | 0.24% | -0.04% | |
| AUD | -0.45% | -0.12% | -0.12% | -0.54% | -0.13% | 0.12% | -0.19% | |
| NZD | -0.56% | -0.24% | -0.24% | -0.62% | -0.24% | -0.12% | -0.29% | |
| CHF | -0.28% | 0.07% | 0.04% | -0.37% | 0.04% | 0.19% | 0.29% |
The heat map shows percentage changes of major currencies against each other. The base currency is picked from the left column, while the quote currency is picked from the top row. For example, if you pick the New Zealand Dollar from the left column and move along the horizontal line to the US Dollar, the percentage change displayed in the box will represent NZD (base)/USD (quote).
Recommended Articles


