

USD/CHF heading for 0.8500 as Swiss Franc climbs into four-month high against Greenback

Source Fxstreet
  • The Swiss Franc is testing further high ground against the US Dollar on Thursday.
  • Risk appetite is cranking up after US inflation data tips lower.
  • US Dollar declines across the board ahead of the holiday market wrap.

The USD/CHF slipped through the 0.8600 handle on Thursday as broader markets push over the US Dollar (USD), bolstering all other major currencies across the board and lifting the Swiss Franc into a new twenty-week high against the Greenback.

US inflation figures missed expectations on Thursday, coming on below forecasts and sparking a risk appetite rally as price growth deceleration takes hold in the US faster than most market participants anticipated, re-igniting market bets of a faster pace of Federal Reserve (Fed) rate cuts in 2024.

At current cut, the Fed’s dot plot of interest rate expectations sees around three rate cuts next year for a combined 75 basis points in interest rate declines, but Thursday’s softer-than-expected inflation print sees markets widening the gap between the Fed’s outlook and investor expectations. Money markets are now pricing in a heady 160 bps in rate cuts through the end of next December.

US Initial Jobless Claims ticked up slightly for the week into December 15, but much less than markets were expecting, printing at 205K versus the previous week’s 203K (revised up from 202K).

Data focus on Thursday was squarely on US Core Personal Consumption Expenditures (PCE) for the third quarter, which declined from 2.3% to 2.0% for the quarter. US Annualized third quarter Gross Domestic Product (GDP) also softened on Thursday to round out the US data dump, coming in at 4.9% versus the forecast steady reading of 5.2%.

With nothing else of note on the economic calendar this week for the Swiss France, market focus will be drawn squarely to US PCE Price Index figures on Friday. The US Core PCE Price Index from November is forecast to print flat at 0.2%, but odds of a downside print are increasing as preview PCE inflation data miss the mark on Thursday.

USD/CHF Technical Outlook

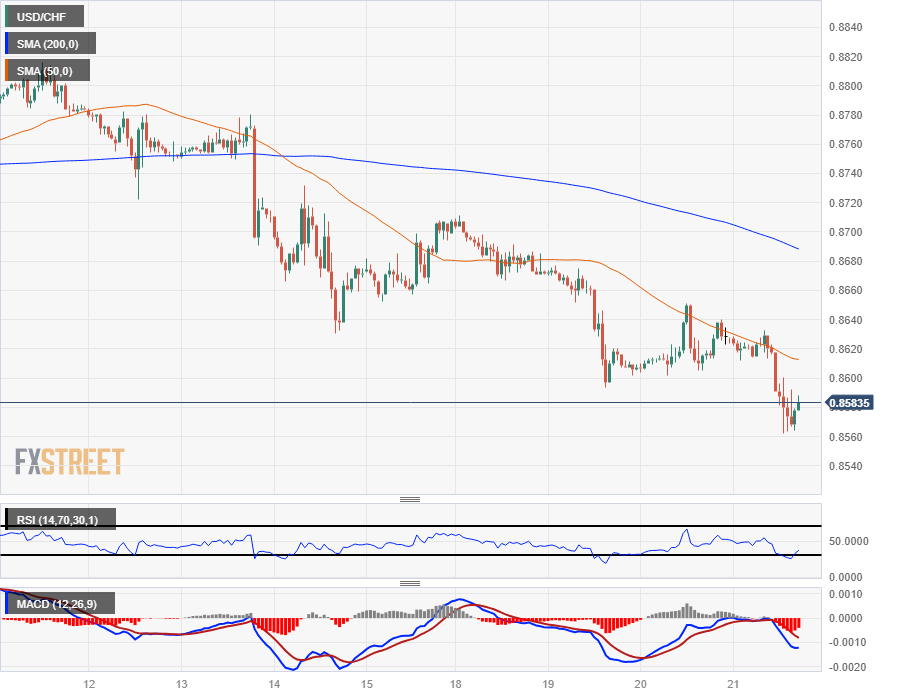
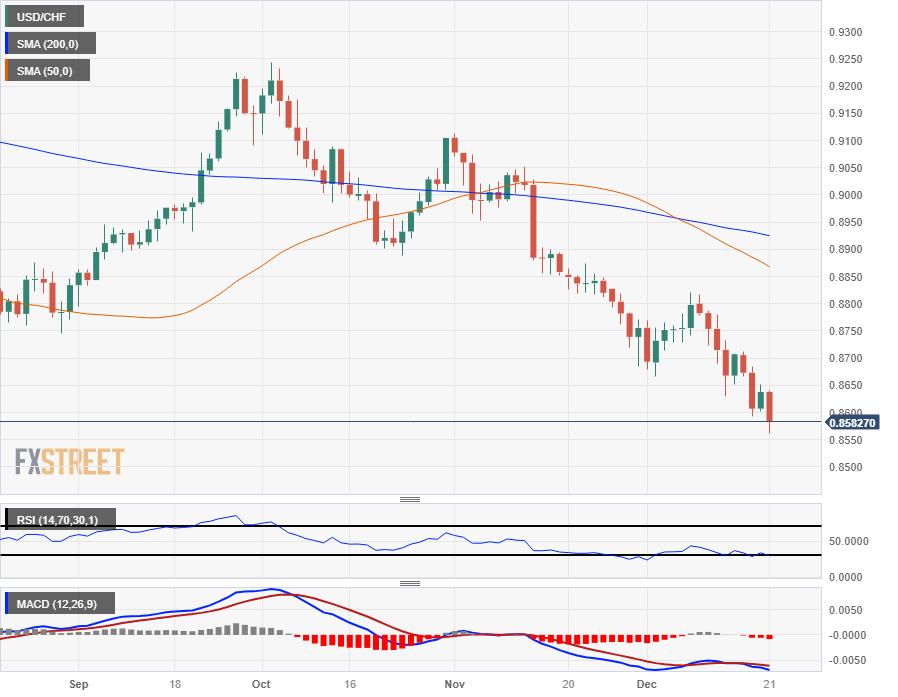
Thursday’s declines in the US Dollar dragged the USD/CHF into a new twenty-week low, slipping below the 0.8600 handle and driving towards 0.8550.

Daily candles show price action continuing to drop away from the 200-day Simple Moving Average (SMA) descending towards 0.8900, and medium-term momentum is tilting towards the downside with the 50-day SMA confirming a bearish cross of the 200-day SMA, and slipping towards 0.8850.

Intraday action continues to play into bearish territory, with bids facing steady rejection from the 50-hour SMA. A topside run will hit the 200-hour SMA near 0.8680, while the downside below 0.860 will see the way paved for additional declines into 2023’s lows.

USD/CHF Hourly Chart
USD/CHF Daily Chart
USD/CHF Technical Levels


Disclaimer: For information purposes only. Past performance is not indicative of future results.
placeholder
US August CPI lands tonight: after a 5.4% PPI shock, will the Fed hike on September 16?US August PPI came in at 5.4% year-on-year, above the 5.3% consensus, with core PPI at 4.6%. Traders have pushed the odds of a 25bp Fed hike on September 15-16 to around 70%. Tonight's CPI is the last major inflation print before the decision — here is the full calendar, the consensus numbers, and what a hot versus cool reading would mean for the dollar, yields, gold and stocks.
Author  Irene Q.
Sep 11, Fri
US August PPI came in at 5.4% year-on-year, above the 5.3% consensus, with core PPI at 4.6%. Traders have pushed the odds of a 25bp Fed hike on September 15-16 to around 70%. Tonight's CPI is the last major inflation print before the decision — here is the full calendar, the consensus numbers, and what a hot versus cool reading would mean for the dollar, yields, gold and stocks.
placeholder
Brent tests $108 as a key export pipeline stays shut — can the rally clear $110?Brent crude rose 2.55% to $106.97 and WTI 2.32% to $102.30 as a major regional export pipeline remained offline with no restart timeline. Front-month backwardation has widened to $5.53 from $3.84 a week ago, European gas is at its highest since December 2022, and one analyst sees $119.48 if talks stall.
Author  Irene Q.
Sep 14, Mon
Brent crude rose 2.55% to $106.97 and WTI 2.32% to $102.30 as a major regional export pipeline remained offline with no restart timeline. Front-month backwardation has widened to $5.53 from $3.84 a week ago, European gas is at its highest since December 2022, and one analyst sees $119.48 if talks stall.
placeholder
Fed hike odds near 90% into Wednesday's decision — how to trade the dollar, gold and the S&P 500A 0.3% monthly core CPI print has lifted the market-implied probability of a 25bp Fed hike on 16 September to roughly 86.5% ~ 90%, which would be the first increase since July 2023. Here is the decision timeline, the pricing versus the forecasts, both scenarios, and the key levels for the dollar, gold and the S&P 500.
Author  Suzie
Sep 14, Mon
A 0.3% monthly core CPI print has lifted the market-implied probability of a 25bp Fed hike on 16 September to roughly 86.5% ~ 90%, which would be the first increase since July 2023. Here is the decision timeline, the pricing versus the forecasts, both scenarios, and the key levels for the dollar, gold and the S&P 500.
placeholder
Gold falls below $4,300 as higher US yields bolster Fed rate hike betsGold price (XAU/USD) tumbles to near $4,295 during the early Asian session on Tuesday. The precious metal faces some selling pressure as rising bond yields and surging energy prices strengthen expectations that the US Federal Reserve (Fed) will raise interest rates this week. 
Author  FXStreet
Yesterday 01: 23
Gold price (XAU/USD) tumbles to near $4,295 during the early Asian session on Tuesday. The precious metal faces some selling pressure as rising bond yields and surging energy prices strengthen expectations that the US Federal Reserve (Fed) will raise interest rates this week. 
placeholder
【Daily Brief】10-year Treasury yield briefly tops 5%, S&P 500 slips to 7,602 and the dollar firms at 99.3 as the Fed's decision eve beginsThe 10-year Treasury yield touched 5.014% on Monday — its first print above 5% since October 2023 — while the S&P 500 closed 0.48% lower at 7,619.98 and the dollar index firmed to 99.3. Here is the full market wrap ahead of Wednesday's FOMC decision, the dot plot and the August retail sales report, plus today's CLARITY Act Senate vote.
Author  Irene Q.
21 hours ago
The 10-year Treasury yield touched 5.014% on Monday — its first print above 5% since October 2023 — while the S&P 500 closed 0.48% lower at 7,619.98 and the dollar index firmed to 99.3. Here is the full market wrap ahead of Wednesday's FOMC decision, the dot plot and the August retail sales report, plus today's CLARITY Act Senate vote.
Related Instrument
goTop
quote