
EUR/AUD Price Forecast: Recovers after plunging below 1.6400 post ECB decision
- EUR/AUD rebounds from a low of 1.6361, trimming earlier losses.
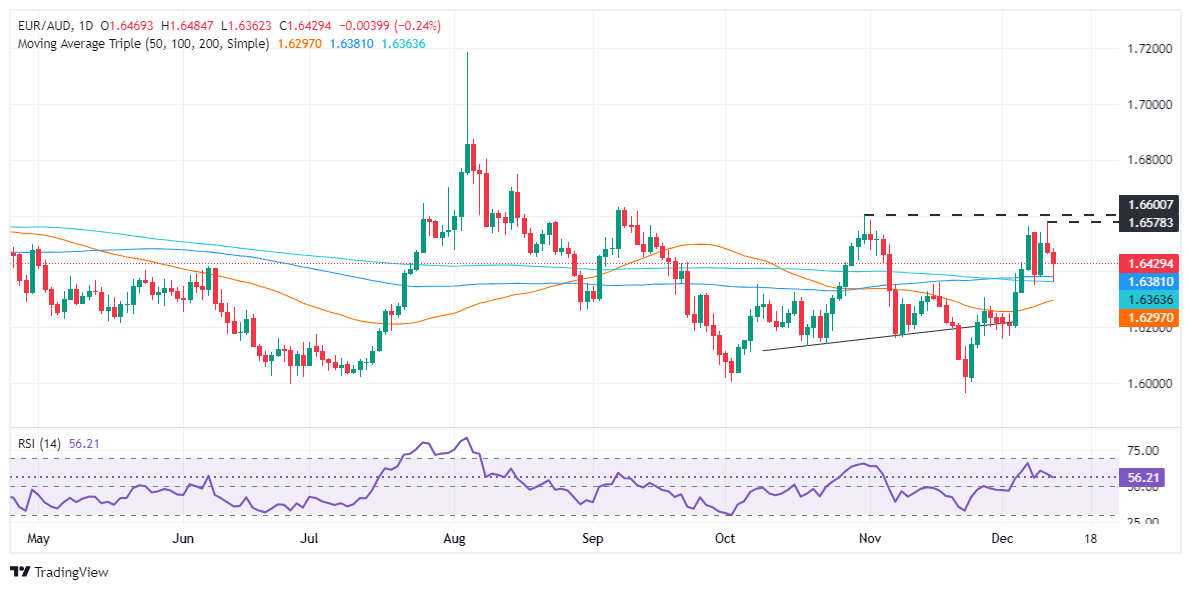
- Technical outlook shows EUR/AUD consolidated within the 1.6350-1.6480 range amid mixed signals.
- Resistance ahead at 1.6500 and 1.6575; support positioned near 1.6400 with potential further dip towards 1.6375/59.
The EUR/AUD trims some of its earlier losses on Thursday as the European Central Bank lowered interest rates. Initially, the cross plunged to a daily low of 1.6361, but it made a U-turn as buyers bought the dip, toward current exchange rates. At the time of wiring, the pair trades at 1.6449, down 0.15%.
EUR/AUD Price Forecast: Technical outlook
The EUR/AUD seesawed after Aussie jobs data and the ECB’s monetary policy meeting, however it remained consolidated at around the1.6350-1.6480 range.
Momentum remains buliish as depicted by the Relative Strength Index (RSI), but sellers are looming after the cross-pair printed back-to-back bearish days.
If EUR/AUD extends its gains past 1.6500, the next resistance would be December 11 swing high at 1.6575. If surpassed, the next stop would be October 30 daily high at 1.6599.
On the other hand, sellers must take out the 1.6400 mark to extend the downtrend towards the confluence of the 100 and 200-day SMAs at 1.6375/59, followed by the 50-day SMA at 1.6281.
EUR/AUD Price Chart – Daily
Euro PRICE Today
The table below shows the percentage change of Euro (EUR) against listed major currencies today. Euro was the strongest against the Japanese Yen.
| USD | EUR | GBP | JPY | CAD | AUD | NZD | CHF | |
|---|---|---|---|---|---|---|---|---|
| USD | -0.00% | -0.06% | -0.03% | -0.04% | -0.07% | -1.77% | -0.03% | |
| EUR | 0.00% | -0.03% | 0.03% | -0.01% | -0.05% | -0.06% | 0.02% | |
| GBP | 0.06% | 0.03% | 0.04% | 0.01% | -0.05% | -0.05% | 0.05% | |
| JPY | 0.03% | -0.03% | -0.04% | -0.02% | -0.05% | -0.09% | 0.03% | |
| CAD | 0.04% | 0.00% | -0.01% | 0.02% | -0.05% | -0.07% | 0.05% | |
| AUD | 0.07% | 0.05% | 0.05% | 0.05% | 0.05% | -0.01% | 0.10% | |
| NZD | 1.77% | 0.06% | 0.05% | 0.09% | 0.07% | 0.01% | 0.11% | |
| CHF | 0.03% | -0.02% | -0.05% | -0.03% | -0.05% | -0.10% | -0.11% |
The heat map shows percentage changes of major currencies against each other. The base currency is picked from the left column, while the quote currency is picked from the top row. For example, if you pick the Euro from the left column and move along the horizontal line to the US Dollar, the percentage change displayed in the box will represent EUR (base)/USD (quote).
Australian Dollar FAQs
One of the most significant factors for the Australian Dollar (AUD) is the level of interest rates set by the Reserve Bank of Australia (RBA). Because Australia is a resource-rich country another key driver is the price of its biggest export, Iron Ore. The health of the Chinese economy, its largest trading partner, is a factor, as well as inflation in Australia, its growth rate and Trade Balance. Market sentiment – whether investors are taking on more risky assets (risk-on) or seeking safe-havens (risk-off) – is also a factor, with risk-on positive for AUD.
The Reserve Bank of Australia (RBA) influences the Australian Dollar (AUD) by setting the level of interest rates that Australian banks can lend to each other. This influences the level of interest rates in the economy as a whole. The main goal of the RBA is to maintain a stable inflation rate of 2-3% by adjusting interest rates up or down. Relatively high interest rates compared to other major central banks support the AUD, and the opposite for relatively low. The RBA can also use quantitative easing and tightening to influence credit conditions, with the former AUD-negative and the latter AUD-positive.
China is Australia’s largest trading partner so the health of the Chinese economy is a major influence on the value of the Australian Dollar (AUD). When the Chinese economy is doing well it purchases more raw materials, goods and services from Australia, lifting demand for the AUD, and pushing up its value. The opposite is the case when the Chinese economy is not growing as fast as expected. Positive or negative surprises in Chinese growth data, therefore, often have a direct impact on the Australian Dollar and its pairs.
Iron Ore is Australia’s largest export, accounting for $118 billion a year according to data from 2021, with China as its primary destination. The price of Iron Ore, therefore, can be a driver of the Australian Dollar. Generally, if the price of Iron Ore rises, AUD also goes up, as aggregate demand for the currency increases. The opposite is the case if the price of Iron Ore falls. Higher Iron Ore prices also tend to result in a greater likelihood of a positive Trade Balance for Australia, which is also positive of the AUD.
The Trade Balance, which is the difference between what a country earns from its exports versus what it pays for its imports, is another factor that can influence the value of the Australian Dollar. If Australia produces highly sought after exports, then its currency will gain in value purely from the surplus demand created from foreign buyers seeking to purchase its exports versus what it spends to purchase imports. Therefore, a positive net Trade Balance strengthens the AUD, with the opposite effect if the Trade Balance is negative.
Recommended Articles


