


GBP/USD Price Forecast: Sinks below 1.2900 amid concerns over Trump’s policies
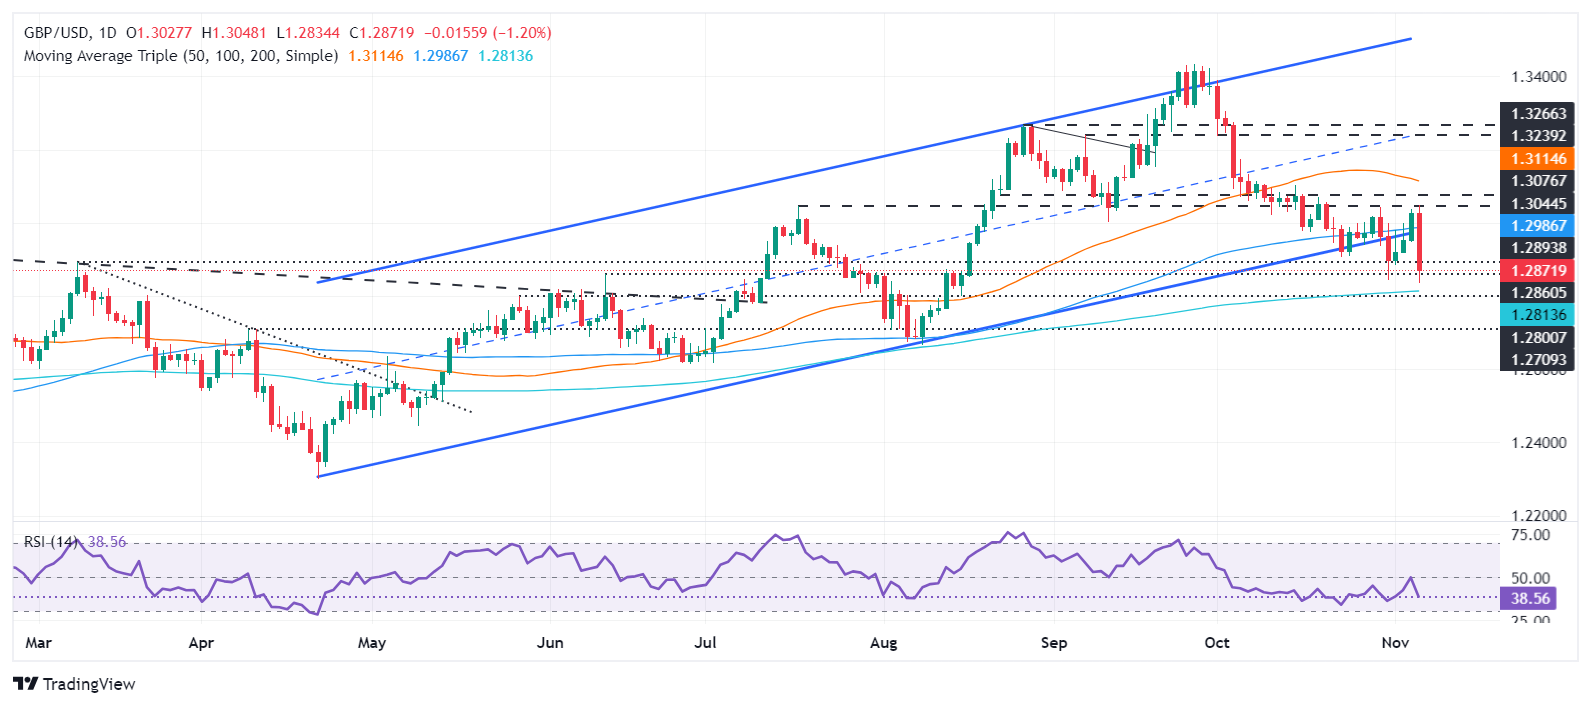
- GBP/USD breaches key 1.2850 level; eyes 200-day SMA support at 1.2811.
- Close below 200-day SMA may lead to further losses, with next support at 1.2664.
- RSI momentum points to bearish control as election fallout pressures Pound.
The Pound Sterling plunged over 1.20% against the US Dollar on Wednesday after former US President Donald Trump won the 2024 Presidential election. Fears of tariffs and protectionist policies weighed on Cable, which is having its worst daily loss since October 3. At the time of writing, GBP/USD trades at 1.2881 after reaching a daily high of 1.3047.
GBP/USD Price Forecast: Technical outlook
The GBP/USD finally broke below the 1.2850 area and hit a daily low of 1.2833 but still fell shy of testing the 200-day Simple Moving Average (SMA) of 1.2811. If the pair achieves a daily close below the 200-day SMA, this will cement its bearish bias, opening the door to test 1.2800. GBP/USD would extend its losses once cleared, and the next support would be seen at 1.2664, the August 8 swing low, followed by the 1.2600 mark.
For a bullish scenario, the GBP/USD must surpass the 1.2900 figure and the 100-day SMA at 1.2985.
Momentum, as measured by the Relative Strength Index (RSI), indicated further downside. The RSI made a U-turn, falling steeper, an indication that sellers are in charge.
GBP/USD Price Chart – Daily
British Pound PRICE Today
The table below shows the percentage change of British Pound (GBP) against listed major currencies today. British Pound was the strongest against the Euro.
| USD | EUR | GBP | JPY | CAD | AUD | NZD | CHF | |
|---|---|---|---|---|---|---|---|---|
| USD | 1.89% | 1.16% | 1.77% | 0.78% | 0.97% | 0.71% | 1.45% | |
| EUR | -1.89% | -0.72% | -0.12% | -1.08% | -0.91% | -1.16% | -0.42% | |
| GBP | -1.16% | 0.72% | 0.60% | -0.37% | -0.19% | -0.44% | 0.30% | |
| JPY | -1.77% | 0.12% | -0.60% | -0.98% | -0.80% | -1.06% | -0.31% | |
| CAD | -0.78% | 1.08% | 0.37% | 0.98% | 0.18% | -0.07% | 0.67% | |
| AUD | -0.97% | 0.91% | 0.19% | 0.80% | -0.18% | -0.26% | 0.50% | |
| NZD | -0.71% | 1.16% | 0.44% | 1.06% | 0.07% | 0.26% | 0.74% | |
| CHF | -1.45% | 0.42% | -0.30% | 0.31% | -0.67% | -0.50% | -0.74% |
The heat map shows percentage changes of major currencies against each other. The base currency is picked from the left column, while the quote currency is picked from the top row. For example, if you pick the British Pound from the left column and move along the horizontal line to the US Dollar, the percentage change displayed in the box will represent GBP (base)/USD (quote).
Recommended Articles


