Canadian Dollar sheds weight for eighth straight day

Source Fxstreet
  • The Canadian Dollar backslid another tenth of a percent against the Greenback.
  • Despite upbeat labor data from Canada, markets deferred to the US Dollar.
  • US PPI inflation cooled to flat in September, but core PPI remains an issue.

The Canadian Dollar (CAD) fell against the Greenback for an eighth consecutive trading day as markets pivot out of the Loonie in favor of the US Dollar. US Producer Price Index (PPI) inflation cooled more than expected in September, but markets noted that core PPI inflation still ticked higher for the annualized period.

Canada’s labor print did little to bolster the CAD, despite new jobs data nearly doubling forecasts. Canada’s Unemployment Rate also ticked down, flaunting market expectations of another move higher. With the Bank of Canada (BoC) broadly expected to deliver another 50 bps rate cut at its next policy meeting later in the month, markets have little reason to bid up the CAD. The Loonie is now poised for its worst week against the Greenback since March of 2023.

Daily digest market movers

  • Canada added 46.7K net new jobs in September, nearly double the median market forecast of 27K, compared to August’s 22.1K.
  • Canada’s Unemployment Rate also ticked down to 6.5% from 6.6%, reversing the expected uptick to 6.7%.
  • Despite upbeat labor figures, the BoC is still expected to cut rates by another 50 bps on October 23.
  • US PPI inflation flatted in September, cooling to a flat 0.0% MoM compared to the expected 0.1% and August’s 0.2%. 
  • September’s YoY PPI print chilled less than expected, printing at 1.8% versus the expected 1.6%, but still came in under August’s revised print of 1.9%.
  • Core PPI inflation, excluding food and energy prices, actually rose to 2.8% YoY in September, over and above the anticipated 2.7%. August’s annualized PPI figure was also revised to 2.6% from the initial print of 2.4%.

Canadian Dollar price forecast

The USD/CAD currency pair continued its recent upward momentum, closing at 1.3762, up 0.15% for the day. The pair has rallied sharply over the past week, recovering from September’s lows near 1.3400. As seen in the chart, the price action is well above the 50-day exponential moving average (EMA) at 1.3605 and the 200-day EMA at 1.3612, indicating a shift toward a more bullish outlook. The pair broke above these key moving averages at the beginning of October, confirming a breakout from the downtrend that had dominated throughout August and September.

Momentum indicators support the recent bullish reversal. The Moving Average Convergence Divergence (MACD) indicator has turned positive, with the MACD line crossing above the signal line. The histogram is steadily increasing, showing growing bullish momentum. With MACD readings now in positive territory, the outlook suggests that further gains are likely in the near term, with the next key resistance level around 1.3800, a psychological and technical barrier that traders are likely to monitor closely.

However, the recent rally has left the pair overextended in the short term, as indicated by the rapid pace of gains over the last few sessions. A pullback to test the 50-day EMA or the 1.3650 level could be possible before the pair attempts to break higher. Overall, the trend appears to have shifted in favor of the USD, but traders should keep an eye on upcoming economic data and any signs of exhaustion in the bullish momentum to manage potential volatility.

USD/CAD daily chart

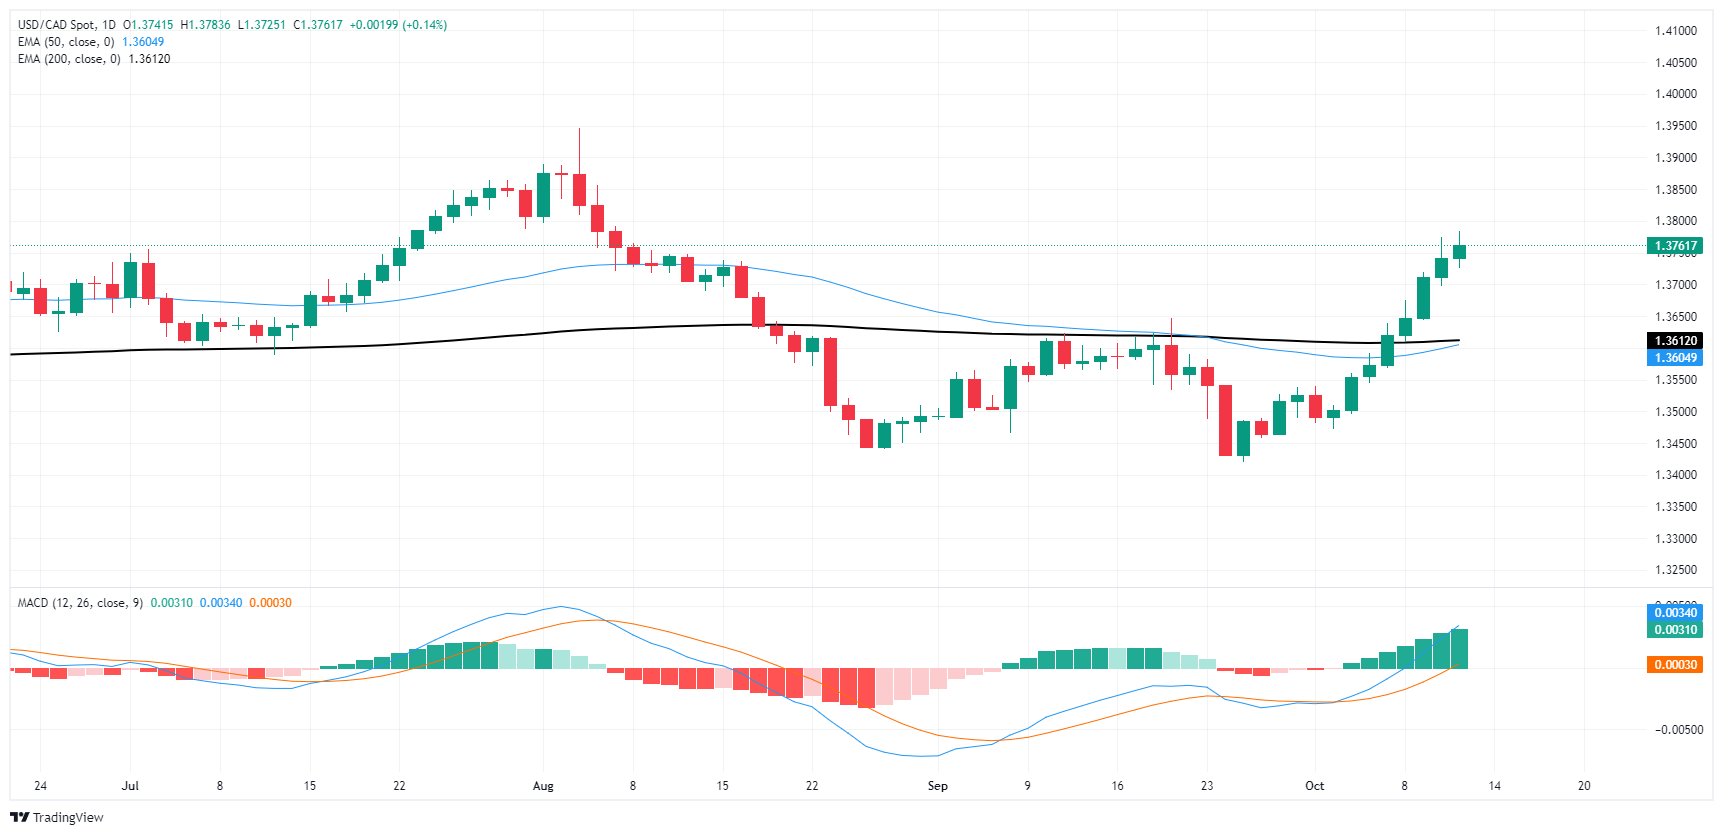
Canadian Dollar FAQs

The key factors driving the Canadian Dollar (CAD) are the level of interest rates set by the Bank of Canada (BoC), the price of Oil, Canada’s largest export, the health of its economy, inflation and the Trade Balance, which is the difference between the value of Canada’s exports versus its imports. Other factors include market sentiment – whether investors are taking on more risky assets (risk-on) or seeking safe-havens (risk-off) – with risk-on being CAD-positive. As its largest trading partner, the health of the US economy is also a key factor influencing the Canadian Dollar.

The Bank of Canada (BoC) has a significant influence on the Canadian Dollar by setting the level of interest rates that banks can lend to one another. This influences the level of interest rates for everyone. The main goal of the BoC is to maintain inflation at 1-3% by adjusting interest rates up or down. Relatively higher interest rates tend to be positive for the CAD. The Bank of Canada can also use quantitative easing and tightening to influence credit conditions, with the former CAD-negative and the latter CAD-positive.

The price of Oil is a key factor impacting the value of the Canadian Dollar. Petroleum is Canada’s biggest export, so Oil price tends to have an immediate impact on the CAD value. Generally, if Oil price rises CAD also goes up, as aggregate demand for the currency increases. The opposite is the case if the price of Oil falls. Higher Oil prices also tend to result in a greater likelihood of a positive Trade Balance, which is also supportive of the CAD.

While inflation had always traditionally been thought of as a negative factor for a currency since it lowers the value of money, the opposite has actually been the case in modern times with the relaxation of cross-border capital controls. Higher inflation tends to lead central banks to put up interest rates which attracts more capital inflows from global investors seeking a lucrative place to keep their money. This increases demand for the local currency, which in Canada’s case is the Canadian Dollar.

Macroeconomic data releases gauge the health of the economy and can have an impact on the Canadian Dollar. Indicators such as GDP, Manufacturing and Services PMIs, employment, and consumer sentiment surveys can all influence the direction of the CAD. A strong economy is good for the Canadian Dollar. Not only does it attract more foreign investment but it may encourage the Bank of Canada to put up interest rates, leading to a stronger currency. If economic data is weak, however, the CAD is likely to fall.


Disclaimer: For information purposes only. Past performance is not indicative of future results.
placeholder
Bitcoin CME gaps at $35,000, $27,000 and $21,000, which one gets filled first?Prioritize filling the $27,000 gap and even try higher.
Author  FXStreet
Aug 22, 2023
Prioritize filling the $27,000 gap and even try higher.
placeholder
Natural Gas sinks to pivotal level as China’s demand slumpsNatural Gas price (XNG/USD) edges lower and sinks to $2.56 on Monday, extending its losing streak for the fifth day in a row. The move comes on the back of China cutting its Liquified Natural Gas (LNG) imports after prices rose above $3.0 in June. It
Author  FXStreet
Jul 01, 2024
Natural Gas price (XNG/USD) edges lower and sinks to $2.56 on Monday, extending its losing streak for the fifth day in a row. The move comes on the back of China cutting its Liquified Natural Gas (LNG) imports after prices rose above $3.0 in June. It
placeholder
Bitcoin briefly loses 2025 gains as crypto plunges over the weekend.Bitcoin experienced a sharp decline this weekend, briefly erasing its 2025 gains and dipping below its year-opening value of $93,507. The cryptocurrency fell to a low of $93,029 on Sunday, representing a 25% drop from its all-time high in October. Although it has rebounded slightly to around $94,209, the pressures on the market remain significant. The downturn occurred despite the reopening of the U.S. government on Thursday, which many had hoped would provide essential support for crypto markets. This year initially appeared promising for cryptocurrencies, particularly after the inauguration of President Donald Trump, who has established the most pro-crypto administration thus far. However, ongoing political tensions—including Trump's tariff strategies and the recent government shutdown, lasting a historic 43 days—have contributed to several rapid price pullbacks for Bitcoin throughout the year. Market dynamics are also being influenced by Bitcoin whales—investors holding large amounts of Bitcoin—who have been offloading portions of their assets, consequently stalling price rallies even as positive regulatory developments emerge. Despite these sell-offs, analysts from Glassnode argue that this behavior aligns with typical patterns seen among long-term investors during the concluding stages of bull markets, suggesting it is not indicative of a mass exodus. Notably, Bitcoin is not alone in its struggles, as Ethereum and Solana have also recorded declines of 7.95% and 28.3%, respectively, since the start of the year, while numerous altcoins have faced even steeper losses. Looking ahead, questions linger regarding the viability of the four-year cycle thesis, particularly given the increasing institutional support and regulatory frameworks now in place in the crypto landscape. Matt Hougan, chief investment officer at Bitwise, remains optimistic, suggesting a potential Bitcoin resurgence in 2026 driven by the “debasement trade” thesis and a broader trend toward increased adoption of stablecoins, tokenization, and decentralized finance. Hougan emphasized the soundness of the underlying fundamentals, pointing to a positive outlook for the sector in the longer term.
Author  Mitrade
Nov 17, 2025
Bitcoin experienced a sharp decline this weekend, briefly erasing its 2025 gains and dipping below its year-opening value of $93,507. The cryptocurrency fell to a low of $93,029 on Sunday, representing a 25% drop from its all-time high in October. Although it has rebounded slightly to around $94,209, the pressures on the market remain significant. The downturn occurred despite the reopening of the U.S. government on Thursday, which many had hoped would provide essential support for crypto markets. This year initially appeared promising for cryptocurrencies, particularly after the inauguration of President Donald Trump, who has established the most pro-crypto administration thus far. However, ongoing political tensions—including Trump's tariff strategies and the recent government shutdown, lasting a historic 43 days—have contributed to several rapid price pullbacks for Bitcoin throughout the year. Market dynamics are also being influenced by Bitcoin whales—investors holding large amounts of Bitcoin—who have been offloading portions of their assets, consequently stalling price rallies even as positive regulatory developments emerge. Despite these sell-offs, analysts from Glassnode argue that this behavior aligns with typical patterns seen among long-term investors during the concluding stages of bull markets, suggesting it is not indicative of a mass exodus. Notably, Bitcoin is not alone in its struggles, as Ethereum and Solana have also recorded declines of 7.95% and 28.3%, respectively, since the start of the year, while numerous altcoins have faced even steeper losses. Looking ahead, questions linger regarding the viability of the four-year cycle thesis, particularly given the increasing institutional support and regulatory frameworks now in place in the crypto landscape. Matt Hougan, chief investment officer at Bitwise, remains optimistic, suggesting a potential Bitcoin resurgence in 2026 driven by the “debasement trade” thesis and a broader trend toward increased adoption of stablecoins, tokenization, and decentralized finance. Hougan emphasized the soundness of the underlying fundamentals, pointing to a positive outlook for the sector in the longer term.
placeholder
WTI Price Forecast: Seems vulnerable near $90.50 as technical breakdown comes into playWest Texas Intermediate (WTI) – the benchmark US Crude Oil price – plummets to a nearly two-week trough during the Asian session on Wednesday in reaction to news that the US and Iran have agreed to a two-week ceasefire.
Author  FXStreet
Yesterday 01: 48
West Texas Intermediate (WTI) – the benchmark US Crude Oil price – plummets to a nearly two-week trough during the Asian session on Wednesday in reaction to news that the US and Iran have agreed to a two-week ceasefire.
placeholder
Gold remains depressed as skepticism over US-Iran truce supports USDGold (XAU/USD) once again shows some resilience below the $4,700 mark during the Asian session on Thursday, and for now, seems to have stalled the previous day's retracement slide from a three-week high.
Author  FXStreet
8 hours ago
Gold (XAU/USD) once again shows some resilience below the $4,700 mark during the Asian session on Thursday, and for now, seems to have stalled the previous day's retracement slide from a three-week high.
Related Instrument
goTop
quote