


Mexican Peso moderately lower, weakens vs. Pound Sterling after UK data
- The Mexican Peso is trading marginally lower in its key pairs on Wednesday.
- It is weakening especially against the Pound Sterling after the release of UK inflation data.
- USD/MXN falls close to major support from a lower channel line and 50-day SMA.
The Mexican Peso (MXN) notes a modest weakness in its most heavily-traded pairs during the European session on Wednesday, falling in particular against the Pound Sterling (GBP), which broadly appreciates after the release of UK inflation data.
Mexican Peso down against the Pound
The Mexican Peso is currently down by over a third of a percent against the Pound Sterling after the release of higher-than-expected UK services and core inflation data for August, which wiped out any hopes of the Bank of England (BoE) cutting interest rates on Thursday. A rate cut had been speculated, which would have put a lid on GBP strength since lower interest rates generally attract less foreign capital inflows. Given that it is now highly unlikely, Sterling is appreciating.
UK headline Consumer Price Index (CPI) in August met expectations of 2.2% year-over-year (YoY) and remained unchanged from the previous month, whilst core CPI rose 3.6% YoY when 3.5% had been expected from 3.3% in July. A rise in Services inflation, which has been a key issue for the BoE, was the final nail in the coffin for hopes of a rate cut.
“..but the rise in services inflation 5.2% to 5.6% suggests the Bank of England will almost certainly press the pause button on interest rate cuts on Thursday. We continue to expect the next 25 basis point rate cut to take place in November," said Ruth Gregory, Deputy Chief UK Economist at Capital Economics.
Big day for the US Dollar as Fed set to announce rate cut
The hot topic for markets is still whether the Federal Reserve (Fed) will cut interest rates by a bigger 50 basis points (0.50%) at the conclusion of its meeting on Wednesday or opt for a standard 25 basis point (bps) cut – 0.25% in percentage terms.
The outcome is likely to cause volatility in the US Dollar (USD) and its pairs, US stocks, and broader global financial markets. A larger rate cut will weaken the USD, leading to a fall in USD/MXN. A smaller cut is probably already priced in.
The Fed’s accompanying Statement of Economic Projections (SEP), with its projected path for interest rates in the future based on officials’ views, as well as growth and inflation forecasts, could also impact markets and FX.
Dalio weighs in on 25-or-50 debate
In an interview with Bloomberg News on Wednesday, Ray Dalio, CIO of Bridgewater Associates, said that the Fed would be looking to balance the needs of creditors to earn a real yield (the gain from debt interest after inflation) with the desire to lower interest repayments for debtors.
“25 pbs would be the right thing to do if you are looking at the whole picture. If you are looking at the mortgage situation, which is worse – and affects more people – then it’s probably 50 bps,” Dalio said.
Based on the economic data alone, he said the “(US) economy is very close to an equilibrium level, except for the debt situation.” “Significant socio-economic and political factors, including polarization in both, were further variables to consider,” added Dalio.
The probability of a larger 0.50% cut stands at 61%, as implied by 30-day Fed Funds futures prices according to the CME FedWatch tool, whilst the probability of a smaller 0.25% cut stands at 39%.
Technical Analysis: USD/MXN nears bottom of channel
USD/MXN has declined within a broad rising channel, forming a Three Black Crows Japanese candlestick pattern on the way down (shaded rectangle) last week. The pattern indicates the probability that prices will fall even lower in the short term. That said, they are already nearing key support at the base of the channel.
USD/MXN Daily Chart
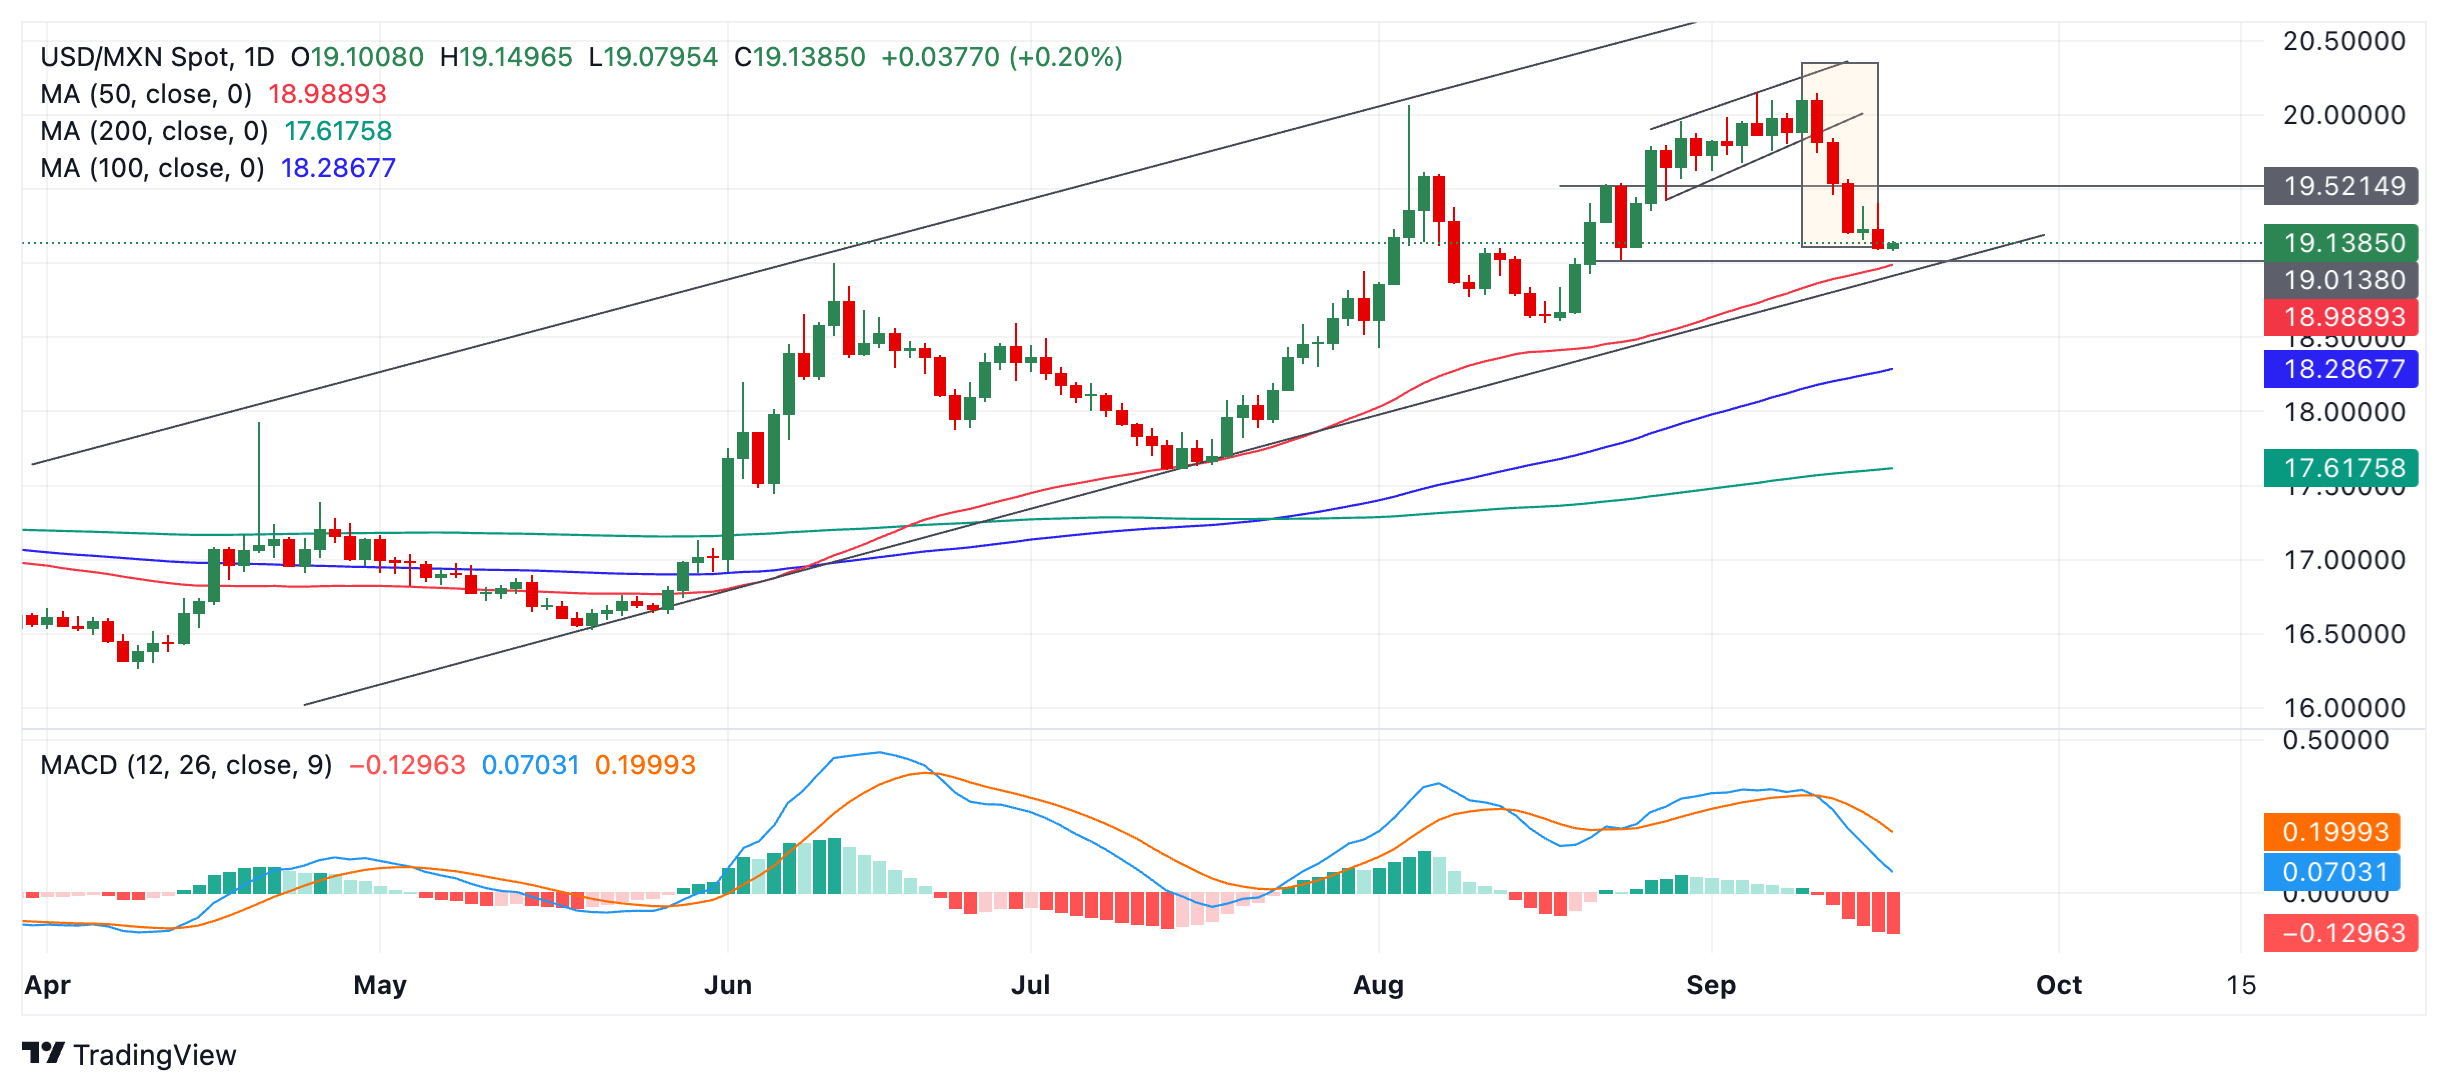
Although USD/MXN has fallen quite far already, the odds favor more weakness to the next downside target and support level at 19.01 (August 23 low), followed perhaps by further weakness to the 50-day Simple Moving Average (SMA) at 18.99 and then the lower trendline of the larger channel a few pips below. At that level, the price will likely find firm support to stabilize and perhaps recover in line with the broader medium and long-term trend.
A decisive break below the lower channel line would indicate a reversal in the medium-term trend. This is a possibility given the risk of volatility on the horizon from the Fed’s announcement and the speed and steepness of the decline so far.
A decisive break would be one accompanied by a long red candle that pierced well below the channel line and closed near its low, or three down days in a row that broke clearly below the line.
Economic Indicator
Core Consumer Price Index (YoY)
The United Kingdom (UK) Core Consumer Price Index (CPI), released by the Office for National Statistics on a monthly basis, is a measure of consumer price inflation – the rate at which the prices of goods and services bought by households rise or fall – produced to international standards. The YoY reading compares prices in the reference month to a year earlier. Core CPI excludes the volatile components of food, energy, alcohol and tobacco. The Core CPI is a key indicator to measure inflation and changes in purchasing trends. Generally, a high reading is seen as bullish for the Pound Sterling (GBP), while a low reading is seen as bearish.
Read more.Last release: Wed Sep 18, 2024 06:00
Frequency: Monthly
Actual: 3.6%
Consensus: 3.5%
Previous: 3.3%
Source: Office for National Statistics
The Bank of England is tasked with keeping inflation, as measured by the headline Consumer Price Index (CPI) at around 2%, giving the monthly release its importance. An increase in inflation implies a quicker and sooner increase of interest rates or the reduction of bond-buying by the BOE, which means squeezing the supply of pounds. Conversely, a drop in the pace of price rises indicates looser monetary policy. A higher-than-expected result tends to be GBP bullish.
Recommended Articles


