EUR/GBP Price Analysis: Bulls gather steam, aim for critical resistance

Source Fxstreet
  • The EUR/GBP rose to 0.8450 aiming for the 20-day SMA
  • The RSI and MACD are projecting that buying pressure is increasing.
  • If the buyers regain the 20-day SMA, the outlook will improve.

In Tuesday's session, the EUR/GBP rose by 0.28% to 0.8450 and extended its sideways trading range tracking the narrow-range movements of the past sessions. A break above the 20-day Simple Moving Average (SMA) which convergences at 0.8450, would confirm a break of the side-ways movements.

The Relative Strength Index (RSI), currently at 50, indicates that the pair is in neutral territory, while the RSI slope is rising sharply, suggesting that buying pressure is recovering. The Moving Average Convergence Divergence (MACD) shows a green histogram with rising bars, revealing that buying pressure is increasing. Combining these technical indicators suggests that bulls are regaining some control. 

EUR/GBP daily chart

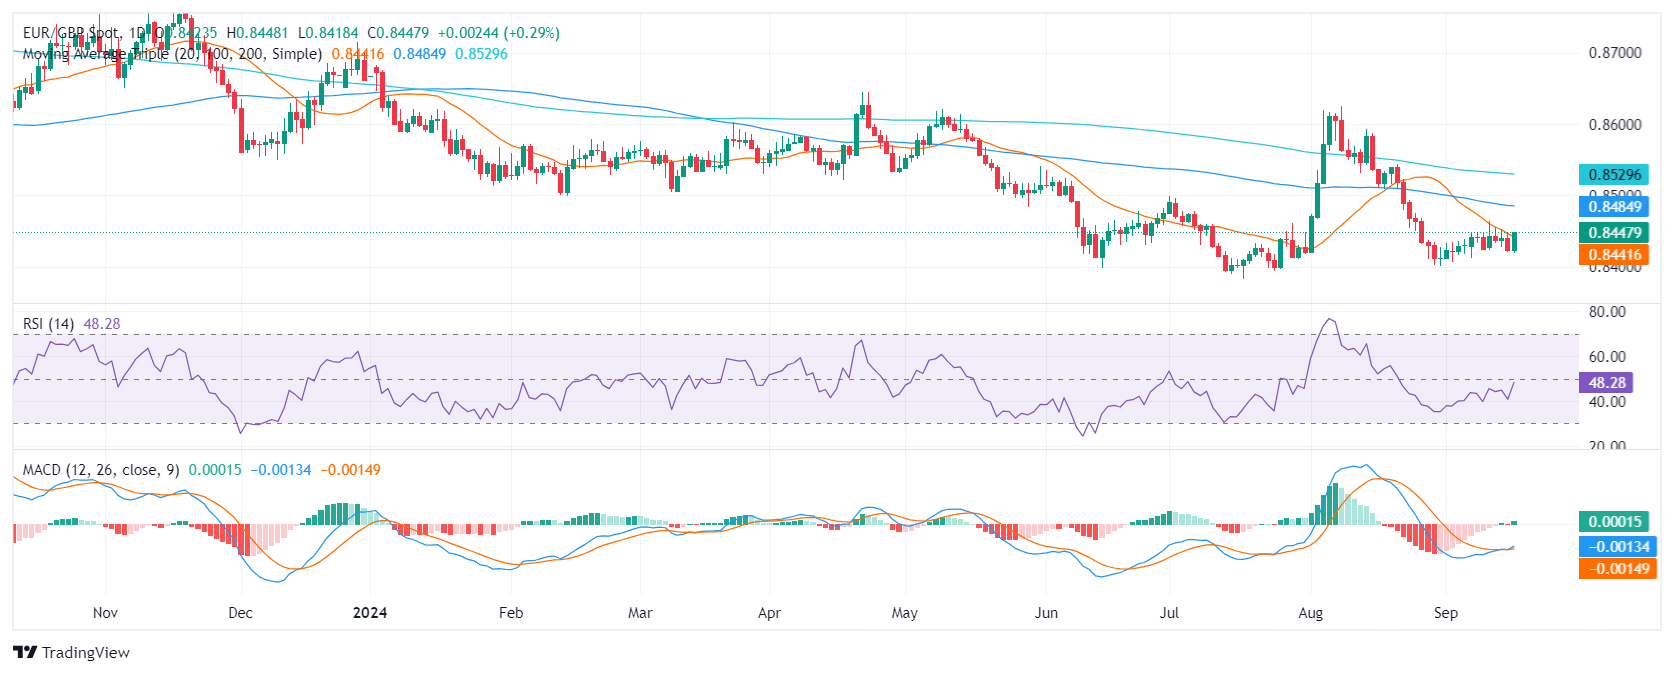
The EUR/GBP pair has been consolidating within a narrow range for the last seven sessions, with little upward or downward momentum. Nonetheless, the pair is trading slightly higher at 0.8450 and has traded primarily within the 0.8420-0.8460 range. If the pair breaks above the immediate resistance level of 0.8460, it could potentially target 0.8480 and 0.8500. Conversely, a break below 0.8420 could open up further downside potential below 0.8400 and 0.8380.


Disclaimer: For information purposes only. Past performance is not indicative of future results.
placeholder
2025 Black Friday is coming! Which stocks may see volatility?Coming on the day right after Thanksgiving in the United States, Back Friday marks the start of the holiday shopping season. Sales data from this shopping frenzy day reflects investor confidence and consumer trends. The National Retail Federation (NRF) predicts that holiday season (Nov and Dec) retail sales in 2025 will likely exceed $1 trillion for the very first time, which represents a year-over-year increase of 3.7 to 4.2 percent. Historic data from the past decade show that the retail sector has generally outperformed the S&P 500 during the weeks before and after Black Friday. The following retailing companies are expected to be big winners:
Author  Insights
Nov 24, Mon
Coming on the day right after Thanksgiving in the United States, Back Friday marks the start of the holiday shopping season. Sales data from this shopping frenzy day reflects investor confidence and consumer trends. The National Retail Federation (NRF) predicts that holiday season (Nov and Dec) retail sales in 2025 will likely exceed $1 trillion for the very first time, which represents a year-over-year increase of 3.7 to 4.2 percent. Historic data from the past decade show that the retail sector has generally outperformed the S&P 500 during the weeks before and after Black Friday. The following retailing companies are expected to be big winners:
placeholder
Bitcoin Bleeds to $86K, But This Key Indicator Screams "The Top Isn't In"Bitcoin’s adjusted Spent Output Profit Ratio (aSOPR) has spent nearly two years coiling below the extremes seen at past bull-market peaks, even as BTC trades around $86,300 and down 9% on the week — a setup that leaves open the possibility that this cycle’s true top may still lie ahead.
Author  Mitrade
Nov 25, Tue
Bitcoin’s adjusted Spent Output Profit Ratio (aSOPR) has spent nearly two years coiling below the extremes seen at past bull-market peaks, even as BTC trades around $86,300 and down 9% on the week — a setup that leaves open the possibility that this cycle’s true top may still lie ahead.
placeholder
Bitcoin Price Rebound Gains Traction with $90K Break in SightBitcoin is trading above $87,000 and its 100-hour SMA after rebounding from $83,500, with a bearish trend line at $88,200 and resistance at $89,000–$90,000 now in focus as BTC either breaks higher toward $91,750–$94,000 or slips back toward $86,700, $85,000 and lower supports.
Author  Mitrade
Yesterday 02: 58
Bitcoin is trading above $87,000 and its 100-hour SMA after rebounding from $83,500, with a bearish trend line at $88,200 and resistance at $89,000–$90,000 now in focus as BTC either breaks higher toward $91,750–$94,000 or slips back toward $86,700, $85,000 and lower supports.
placeholder
Bitcoin Targets $89K Breakout as S&P 500 Nears ATH on Fed Rate Cut HopesBitcoin price action shows signs of a potential short squeeze as it hovers near $88,000, with analysts watching liquidity dynamics that could push it toward $89,000 or retrace to $85,000.
Author  Mitrade
4 hours ago
Bitcoin price action shows signs of a potential short squeeze as it hovers near $88,000, with analysts watching liquidity dynamics that could push it toward $89,000 or retrace to $85,000.
placeholder
Ethereum Reclaims $3K Handle—Is a Breakout Imminent?Ethereum has jumped back above $3,000 and reclaimed key Fib levels, with a bullish trend line at $2,880 and strong MACD/RSI readings putting a breakout above $3,120–$3,165 — and a possible run toward $3,320–$3,350 — on the table, as long as support around $2,980–$2,920 holds.
Author  Mitrade
4 hours ago
Ethereum has jumped back above $3,000 and reclaimed key Fib levels, with a bullish trend line at $2,880 and strong MACD/RSI readings putting a breakout above $3,120–$3,165 — and a possible run toward $3,320–$3,350 — on the table, as long as support around $2,980–$2,920 holds.
goTop
quote