EUR/USD dips as German inflation falls, ECB rate cut looms

Source Fxstreet
  • German HICP inflation falls to 2%, increasing the likelihood of further ECB rate cuts and downward revisions to growth forecasts.
  • ECB expected to lower rates by 25 bps while maintaining a restrictive policy stance to combat inflation risks.
  • US CPI data could influence Fed rate expectations, with a 70% chance of a 25 bps cut and 30% for a 50 bps cut.

The EUR/USD retreated on Tuesday after the latest inflation report in Germany, which increased the likelihood of another interest rate cut by the European Central Bank (ECB). At the time of writing, the EUR/USD trades at 1.1021, virtually unchanged, as Wednesday’s Asian session begins.

EUR/USD retreats to 1.1021 as lower German inflation fuels expectations of a 25 bps ECB rate cut on Thursday

Wall Street ended the session with decent gains, while the Greenback is almost flat. Data during the European session witnessed German inflation falling to its lowest level in over three years as the Harmonized Index of Consumer Prices (HICP) hit 2%, the ECB’s goal.

On Thursday, the ECB is expected to lower interest rates by a quarter of a percentage point, yet according to analysts at BBH, the central bank would emphasize that “it will keep policy sufficiently restrictive for as long as necessary."

Besides that, the ECB is expected to update its economic projections, which include a downward revision of economic growth and inflation. Money market traders continue to price in 50 to 75 basis points of cuts toward the end of the year.

Ahead of the week, August's US Consumer Price Index (CPI) is expected to dip towards the Fed’s 2% goal. A lower-than-expected CPI report could increase the odds of the Federal Reserve easing rates by 50 basis points, though most analysts expect the Fed to adjust policy gradually.

The CME FedWatch Tool shows that the odds for a 25 bps rate cut are 70%, while for a 50 bps rate cut, they are 30%.

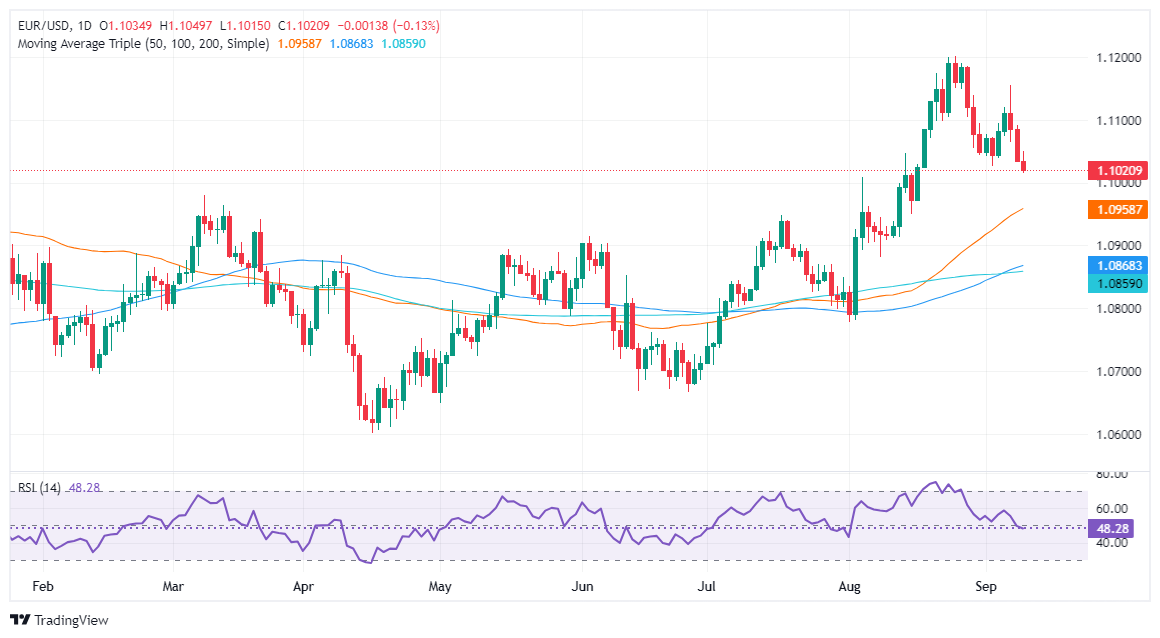
EUR/USD Price Forecast: Technical outlook

From a technical standpoint, the EUR/USD remains neutral with an upward bias. However, a decisive break below the September 3 low of 1.1026 could open the door to further downside. Key support levels, such as the 1.1000 mark, will be exposed, followed by the 50-day moving average (DMA) at 1.0958. A breach of this level could lead to a test of the confluence of the 100 and 200-DMAs around 1.0867/58, before targeting the August 1 swing low at 1.0777.

For a bullish resumption, buyers would need to lift the pair above the September 9 high at 1.1091.

Euro FAQs

The Euro is the currency for the 20 European Union countries that belong to the Eurozone. It is the second most heavily traded currency in the world behind the US Dollar. In 2022, it accounted for 31% of all foreign exchange transactions, with an average daily turnover of over $2.2 trillion a day. EUR/USD is the most heavily traded currency pair in the world, accounting for an estimated 30% off all transactions, followed by EUR/JPY (4%), EUR/GBP (3%) and EUR/AUD (2%).

The European Central Bank (ECB) in Frankfurt, Germany, is the reserve bank for the Eurozone. The ECB sets interest rates and manages monetary policy. The ECB’s primary mandate is to maintain price stability, which means either controlling inflation or stimulating growth. Its primary tool is the raising or lowering of interest rates. Relatively high interest rates – or the expectation of higher rates – will usually benefit the Euro and vice versa. The ECB Governing Council makes monetary policy decisions at meetings held eight times a year. Decisions are made by heads of the Eurozone national banks and six permanent members, including the President of the ECB, Christine Lagarde.

Eurozone inflation data, measured by the Harmonized Index of Consumer Prices (HICP), is an important econometric for the Euro. If inflation rises more than expected, especially if above the ECB’s 2% target, it obliges the ECB to raise interest rates to bring it back under control. Relatively high interest rates compared to its counterparts will usually benefit the Euro, as it makes the region more attractive as a place for global investors to park their money.

Data releases gauge the health of the economy and can impact on the Euro. Indicators such as GDP, Manufacturing and Services PMIs, employment, and consumer sentiment surveys can all influence the direction of the single currency. A strong economy is good for the Euro. Not only does it attract more foreign investment but it may encourage the ECB to put up interest rates, which will directly strengthen the Euro. Otherwise, if economic data is weak, the Euro is likely to fall. Economic data for the four largest economies in the euro area (Germany, France, Italy and Spain) are especially significant, as they account for 75% of the Eurozone’s economy.

Another significant data release for the Euro is the Trade Balance. This indicator measures the difference between what a country earns from its exports and what it spends on imports over a given period. If a country produces highly sought after exports then its currency will gain in value purely from the extra demand created from foreign buyers seeking to purchase these goods. Therefore, a positive net Trade Balance strengthens a currency and vice versa for a negative balance.


Disclaimer: For information purposes only. Past performance is not indicative of future results.
placeholder
Gold Price Forecast: XAU/USD drifts higher above $4,200 as Fed delivers expected cutGold price (XAU/USD) gains momentum to around $4,235 during the early Asian session on Thursday. The precious metal extends its upside after the US Federal Reserve (Fed) delivered an expected third consecutive interest rate cut and maintained its outlook for just one cut in 2026.
Author  FXStreet
Dec 11, Thu
Gold price (XAU/USD) gains momentum to around $4,235 during the early Asian session on Thursday. The precious metal extends its upside after the US Federal Reserve (Fed) delivered an expected third consecutive interest rate cut and maintained its outlook for just one cut in 2026.
placeholder
Ethereum Price Slips Lower — $3,000 Looms as the Key BattlegroundEthereum is attempting to recover from a $3,026 low but remains below $3,200 and the 100-hour SMA, with a bearish trend line near $3,175 capping rebounds as bulls need a clean break above $3,200 to target $3,250–$3,400, while a drop below $3,050 risks a retest of $3,000 and $2,940.
Author  Mitrade
Dec 15, Mon
Ethereum is attempting to recover from a $3,026 low but remains below $3,200 and the 100-hour SMA, with a bearish trend line near $3,175 capping rebounds as bulls need a clean break above $3,200 to target $3,250–$3,400, while a drop below $3,050 risks a retest of $3,000 and $2,940.
placeholder
Macro Analysts: Hawkish Japan Could Push Bitcoin Below $70KAnalysts predict Bitcoin may face further declines towards the $70,000 mark if the Bank of Japan raises interest rates as expected.
Author  Mitrade
Dec 15, Mon
Analysts predict Bitcoin may face further declines towards the $70,000 mark if the Bank of Japan raises interest rates as expected.
placeholder
Bitcoin Slides 5% as Sellers Lean In — Can BTC Reclaim $88,000?Bitcoin has dropped back below $88,000 after rolling over from $90,500, with price still trading under the 100-hour Simple Moving Average. The sell-off found a floor at $85,151, and BTC is now consolidating near that base, but rebounds are facing pressure from a bearish trend line around $89,000. Bulls need to retake $88,000–$89,000 to ease downside risk; failure to do so keeps $85,500–$85,000 and then $83,500 in play, with $80,000 as the deeper “line in the sand.” Bitcoin (BTC) is back in damage-control mode after a sharp pullback wiped out recent gains. The price failed to reclaim the $90,000–$90,500 band, rolled over, and slid through $88,500 before briefly dipping under $87,000. Buyers did show up around $85,000, but the rebound so far looks more like stabilization than a clear trend reversal. Bitcoin dips hard, finds a bid near $85,000(h3) BTC’s latest move lower began when it couldn’t build follow-through above $90,000 and $90,500. Once that upside stalled, sellers took control and pushed price down through $88,500. The slide accelerated enough to spike below $87,000, but the market didn’t free-fall. Bulls defended the $85,000 zone, printing a low at $85,151. Since then, Bitcoin has been consolidating below the 23.6% Fibonacci retracement of the drop from the $93,560 swing high to the $85,151 low — a clue that the bounce is still shallow and that sellers haven’t fully backed off yet. Structurally, BTC is still on the back foot: It’s trading below $88,000, and It remains below the 100-hour Simple Moving Average, keeping short-term trend pressure pointed downward. Resistance is layered, and $89,000 is the problem area(h3) If bulls try to turn this into a recovery, they’ll have to climb through multiple ceilings in quick succession. First, BTC faces resistance around $87,150, followed by a more meaningful barrier near $87,500. From there, the market’s attention snaps back to $88,000 — the level BTC just lost and now needs to reclaim. A close back above $88,000 would improve the tone, but it doesn’t solve the bigger issue: there’s a bearish trend line on the hourly BTC/USD chart (Kraken feed) with resistance near $89,000, which also lines up with the next technical hurdle. If BTC can push through $89,000 and hold, the rebound could extend toward $90,000, with follow-through targets at $91,000 and $91,500. But until price clears that $88,000–$89,000 zone, rallies are at risk of being sold rather than chased. If BTC fails to reclaim resistance, the downside path is clear(h3) The near-term bear case is simple: if Bitcoin can’t climb back above the $87,000 area and keep traction, sellers may attempt another leg lower. Support levels line up like this: Immediate support: $85,500 First major support: $85,000 Next support: $83,500 Then $82,500 in the near term Below that, the major “don’t break this” level is still $80,000. If BTC slips under $80,000, the risk of acceleration to the downside increases significantly — not because it’s magic, but because it’s the kind of psychological and structural level that tends to trigger forced de-risking. Indicators: momentum still leans bearish(h3) The intraday indicators aren’t offering much comfort yet: Hourly MACD is losing pace in the bearish zone. Hourly RSI remains below 50, suggesting sellers still have the upper hand on short timeframes. So while the $85,000 defense held for now, the market hasn’t flipped bullish — it’s just stopped bleeding.
Author  Mitrade
Yesterday 02: 56
Bitcoin has dropped back below $88,000 after rolling over from $90,500, with price still trading under the 100-hour Simple Moving Average. The sell-off found a floor at $85,151, and BTC is now consolidating near that base, but rebounds are facing pressure from a bearish trend line around $89,000. Bulls need to retake $88,000–$89,000 to ease downside risk; failure to do so keeps $85,500–$85,000 and then $83,500 in play, with $80,000 as the deeper “line in the sand.” Bitcoin (BTC) is back in damage-control mode after a sharp pullback wiped out recent gains. The price failed to reclaim the $90,000–$90,500 band, rolled over, and slid through $88,500 before briefly dipping under $87,000. Buyers did show up around $85,000, but the rebound so far looks more like stabilization than a clear trend reversal. Bitcoin dips hard, finds a bid near $85,000(h3) BTC’s latest move lower began when it couldn’t build follow-through above $90,000 and $90,500. Once that upside stalled, sellers took control and pushed price down through $88,500. The slide accelerated enough to spike below $87,000, but the market didn’t free-fall. Bulls defended the $85,000 zone, printing a low at $85,151. Since then, Bitcoin has been consolidating below the 23.6% Fibonacci retracement of the drop from the $93,560 swing high to the $85,151 low — a clue that the bounce is still shallow and that sellers haven’t fully backed off yet. Structurally, BTC is still on the back foot: It’s trading below $88,000, and It remains below the 100-hour Simple Moving Average, keeping short-term trend pressure pointed downward. Resistance is layered, and $89,000 is the problem area(h3) If bulls try to turn this into a recovery, they’ll have to climb through multiple ceilings in quick succession. First, BTC faces resistance around $87,150, followed by a more meaningful barrier near $87,500. From there, the market’s attention snaps back to $88,000 — the level BTC just lost and now needs to reclaim. A close back above $88,000 would improve the tone, but it doesn’t solve the bigger issue: there’s a bearish trend line on the hourly BTC/USD chart (Kraken feed) with resistance near $89,000, which also lines up with the next technical hurdle. If BTC can push through $89,000 and hold, the rebound could extend toward $90,000, with follow-through targets at $91,000 and $91,500. But until price clears that $88,000–$89,000 zone, rallies are at risk of being sold rather than chased. If BTC fails to reclaim resistance, the downside path is clear(h3) The near-term bear case is simple: if Bitcoin can’t climb back above the $87,000 area and keep traction, sellers may attempt another leg lower. Support levels line up like this: Immediate support: $85,500 First major support: $85,000 Next support: $83,500 Then $82,500 in the near term Below that, the major “don’t break this” level is still $80,000. If BTC slips under $80,000, the risk of acceleration to the downside increases significantly — not because it’s magic, but because it’s the kind of psychological and structural level that tends to trigger forced de-risking. Indicators: momentum still leans bearish(h3) The intraday indicators aren’t offering much comfort yet: Hourly MACD is losing pace in the bearish zone. Hourly RSI remains below 50, suggesting sellers still have the upper hand on short timeframes. So while the $85,000 defense held for now, the market hasn’t flipped bullish — it’s just stopped bleeding.
placeholder
Senate Delays Crypto Market Structure Hearings to Early 2026The Senate Banking Committee has postponed cryptocurrency market structure hearings until 2026, citing ongoing bipartisan negotiations.
Author  Mitrade
23 hours ago
The Senate Banking Committee has postponed cryptocurrency market structure hearings until 2026, citing ongoing bipartisan negotiations.
goTop
quote