

NZD/JPY Price Analysis: Persistent downtrend extends, bears test critical supports

Source Fxstreet
  • NZD/JPY continues in its relentless sell-off, propelled by bearish technical indicators and dwindling volume.
  • The RSI remains in oversold territory, indicating potential exhaustion of the prevailing down move.
  • The MACD maintains its bearish alignment, aligning with the general trend.

The NZD/JPY pair remains entrenched in its bearish trajectory, giving no respite to the bears as it approaches critical support levels. This persistent decline has extended across multiple trading sessions, with the NZD/JPY shedding over 10% of its value since its highs in recent weeks. Notably, the pair has breached the 89.00 psychological level and settled well below the 200-day Simple Moving Average (SMA).

On Monday, the NZD/JPY fell by 1.60% to 86.00, reinforcing the sellers' dominance but cleared losses which plunged the index to a low of around 83.00, a critical support level. While the pair has been relentlessly declining, technical indicators like the Relative Strength Index (RSI) continue flashing oversold conditions are approaching. Such conditions may hint at a potential pause in the downtrend. Currently, the RSI resides around 20, signaling a prolonged period of selling, though a potential trend reversal remains a possibility.

NZD/JPY daily chart
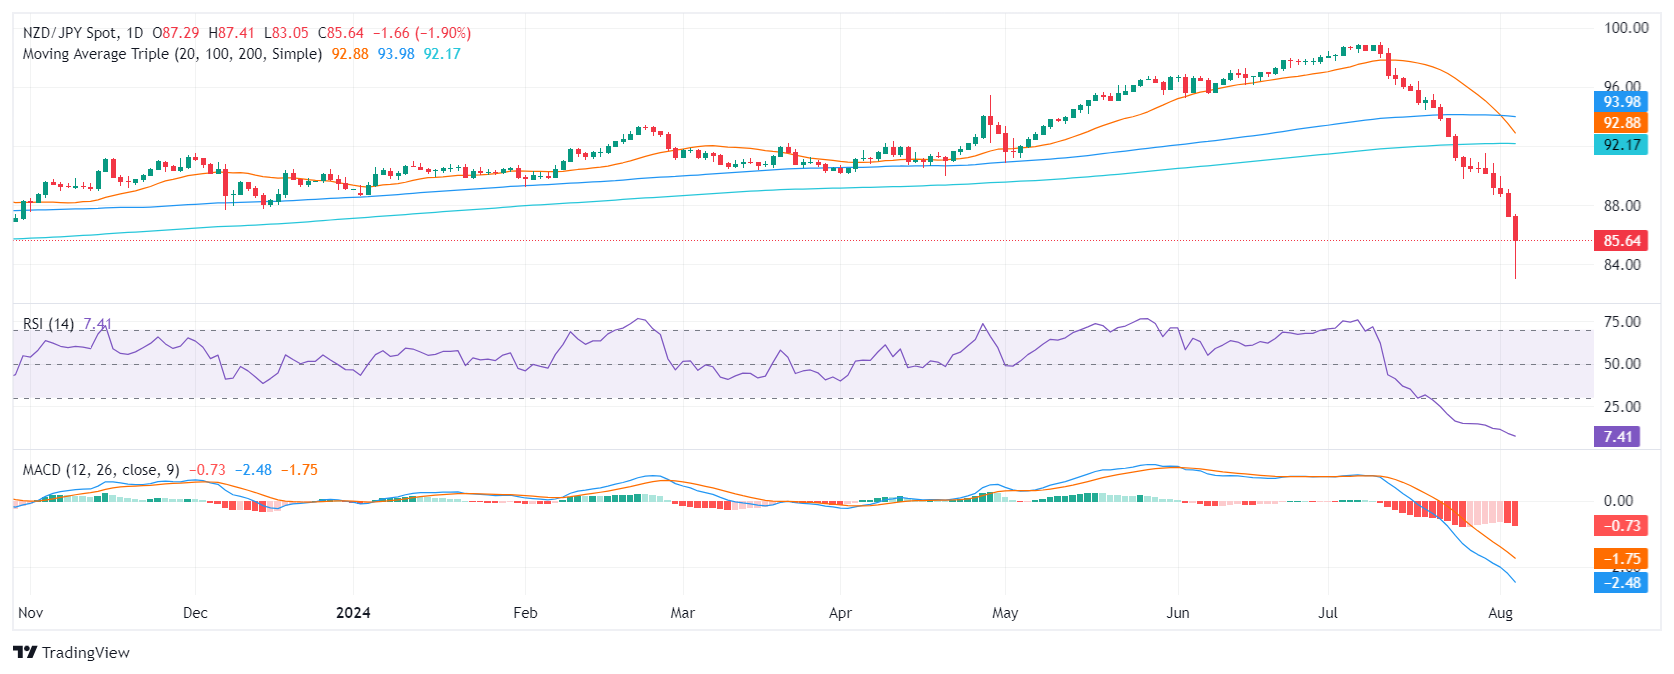
Navigating the depths of its descent, the pair is hovering near the 86.00 support level. Should this level fail to hold, further support awaits at 85.50 and 85.00, representing potential areas for a temporary reprieve. Conversely, resistance levels are positioned at 89.00 and 90.00, with the latter coinciding with the 200-day SMA.

Disclaimer: For information purposes only. Past performance is not indicative of future results.
placeholder
China's factories are pricing in 5.7%. Its shoppers are pricing in 0.7%.China's October PPI rose 5.7% year on year, the fastest since June 2022, while CPI slowed to 0.7% and core CPI to 0.8%. Input prices rose faster than factory-gate prices, squeezing mid-stream margins by roughly five percentage points. The Hang Seng fell 0.13% on a day the S&P 500 rose 2.35%, the only major market to sit out the risk-on session.
Author  Irene Q.
Nov 10, Tue
China's October PPI rose 5.7% year on year, the fastest since June 2022, while CPI slowed to 0.7% and core CPI to 0.8%. Input prices rose faster than factory-gate prices, squeezing mid-stream margins by roughly five percentage points. The Hang Seng fell 0.13% on a day the S&P 500 rose 2.35%, the only major market to sit out the risk-on session.
placeholder
Gold Price Analysis Today | Forex Gold Analysis | XAU/USD Analysis - November 11, 2026Get the latest gold price analysis, forex gold insights, and XAU/USD analysis for November 11, 2026. Read on for the details.
Author  Mitrade
Nov 11, Wed
Get the latest gold price analysis, forex gold insights, and XAU/USD analysis for November 11, 2026. Read on for the details.
placeholder
Gold Extends Slide Below $4,000 as Rising US Inflation, Fed December Hike Bets Pressure Prices On November 12, gold prices (XAUUSD) extended their recent losses, falling further below $4,000 in early Asian trading to hit an intraday low near $3,968, marking a third consecutive day
Author  TradingKey
Yesterday 02: 00
On November 12, gold prices (XAUUSD) extended their recent losses, falling further below $4,000 in early Asian trading to hit an intraday low near $3,968, marking a third consecutive day
placeholder
Gold closed below $4,000 again — the ETF crowd and central banks stayed, the momentum money leftSpot gold is trading near $3,999, its third consecutive lower daily low, after a 5.00% 10-year yield and a 102.85 dollar index raised the odds of a December hike to 87%. But the selling is not coming from the strategic holders: managed-money net longs fell to 324 tonnes, a 21-week low, and Goldman Sachs attributes roughly 95% of five weeks of selling to non-reportable positions. ETFs still hold a record 4,256 tonnes and central banks bought 321 tonnes in Q3. The table below sets the triggers, directions and levels.
Author  Irene Q.
Yesterday 03: 20
Spot gold is trading near $3,999, its third consecutive lower daily low, after a 5.00% 10-year yield and a 102.85 dollar index raised the odds of a December hike to 87%. But the selling is not coming from the strategic holders: managed-money net longs fell to 324 tonnes, a 21-week low, and Goldman Sachs attributes roughly 95% of five weeks of selling to non-reportable positions. ETFs still hold a record 4,256 tonnes and central banks bought 321 tonnes in Q3. The table below sets the triggers, directions and levels.
placeholder
US October PPI Preview: Fed Rate Hike Expectations Rise, PPI May Be Key Variable; How Will US Stocks, Dollar, and Gold Move?On Friday (Nov. 13) Eastern Time, the U.S. will release the October Producer Price Index (PPI). Following the October CPI once again exceeding expectations, the market will look to the PP
Author  TradingKey
Yesterday 08: 36
On Friday (Nov. 13) Eastern Time, the U.S. will release the October Producer Price Index (PPI). Following the October CPI once again exceeding expectations, the market will look to the PP
Related Instrument
goTop
quote