NZD/USD Price Analysis: Entering consolidation period after sharp losses in July

Source Fxstreet
  • NZD/USD made gains in Tuesday's session, rising to the 0.5900 mark.
  • The pair seems to be entering a consolidation period guiding between the 0.5850 - 0.6000 channel.
  • The daily RSI escapes the oversold territory, suggesting some cooling off from bearish momentum.

In Tuesday's trading session, the NZD/USD pair advanced upwards to 0.5900, marking a modest recovery of a 0.40% gain. This follows a bearish July, which saw the pair losing over 4% of its value. Traders had to navigate through a barrage of selling signals especially with the bearish crossover of the 20-day Simple Moving Average (SMA) at 0.6050 with the 100-day SMA last week. However, signs now suggest that the pair may be entering a consolidation period.

The daily Relative Strength Index (RSI) has now moved from oversold territory, signaling a potential easing of the selling pressure. Meanwhile, the Moving Average Convergence Divergence (MACD) continues to print flat red bars, underlining the overall bearish outlook, though indicating a possible moderation of the traction.

NZD/USD daily chart

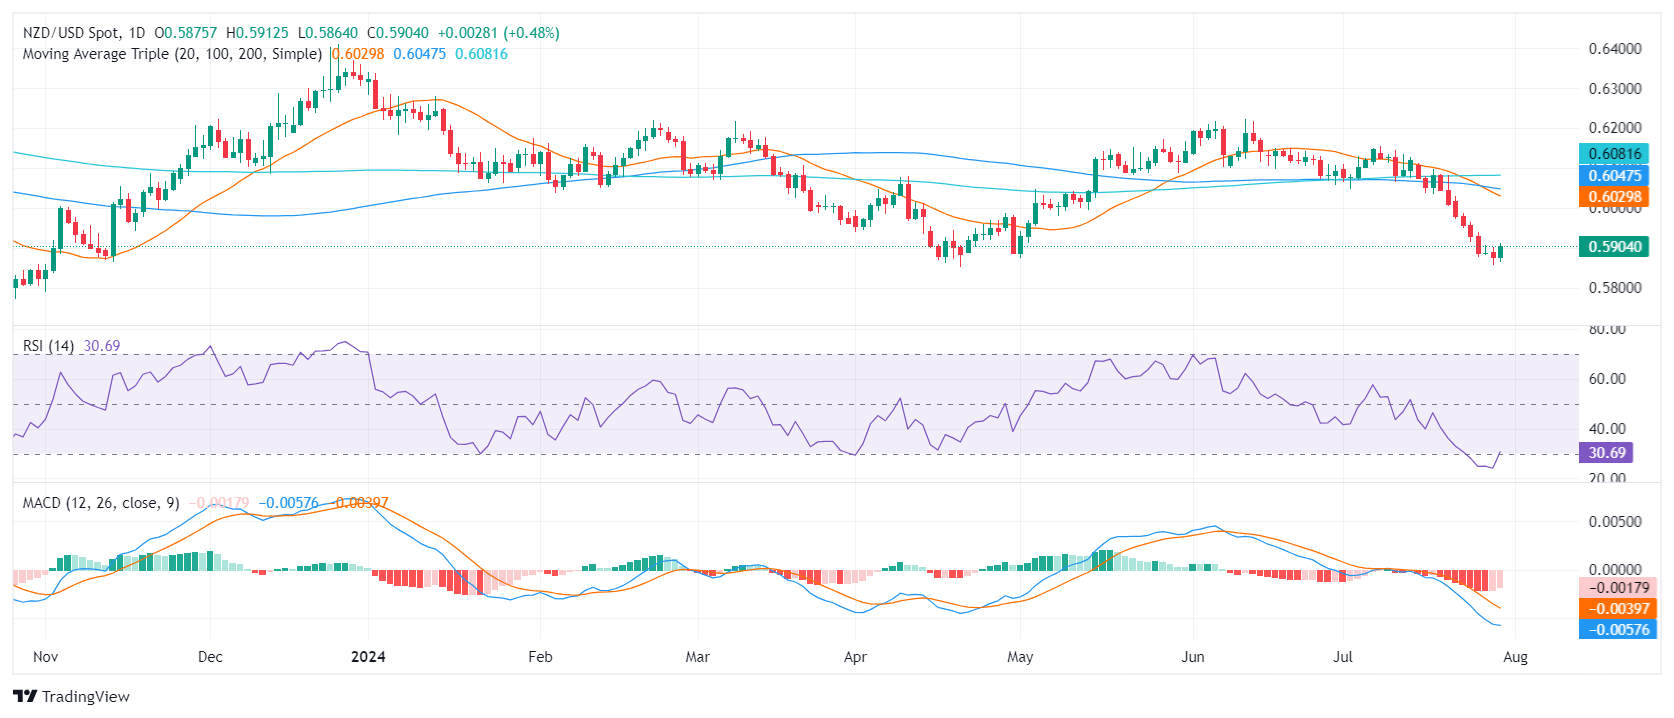
The recently defined support zone is found within the 0.5850 - 0.5900 range, which also serves as a consolidation channel. Resistance is now at the former supports of 0.5950, 0.6000, and 0.6050. For the next sessions, if the buyers can hold their ground above this support area, they could prepare for a possible upward journey. Conversely, a move below this level could see the pair revert back to the bearish trend.

Disclaimer: For information purposes only. Past performance is not indicative of future results.
placeholder
Ethereum (ETH) Price Closes Above $3,900 — Is a New All-Time High Possible Before 2024 Ends?Once again, the price of Ethereum (ETH) has risen above $3,900. This bounce has hinted at a further price increase for the altcoin before the end of the year.
Author  Beincrypto
Dec 17, 2024
Once again, the price of Ethereum (ETH) has risen above $3,900. This bounce has hinted at a further price increase for the altcoin before the end of the year.
placeholder
Pi Network Price Annual Forecast: PI Heads Into a Volatile 2026 as Utility Questions Collide With Big UnlocksPi Network heads into 2026 after a 90%+ 2025 drawdown from $3.00, with 17.5 million KYC users and a smart-contract-focused Stellar v23 upgrade offering upside potential, but 1.21 billion tokens unlocking and heavy exchange deposits (437 million PI) keeping supply pressure and trust risks firmly in focus.
Author  Mitrade
Dec 19, 2025
Pi Network heads into 2026 after a 90%+ 2025 drawdown from $3.00, with 17.5 million KYC users and a smart-contract-focused Stellar v23 upgrade offering upside potential, but 1.21 billion tokens unlocking and heavy exchange deposits (437 million PI) keeping supply pressure and trust risks firmly in focus.
placeholder
ECB Policy Outlook for 2026: What It Could Mean for the Euro’s Next MoveWith the ECB likely holding rates steady at 2.15% and the Fed potentially extending cuts into 2026, EUR/USD may test 1.20 if Eurozone growth proves resilient, but weaker growth and an ECB pivot could pull the pair back toward 1.13 and potentially 1.10.
Author  Mitrade
Dec 26, 2025
With the ECB likely holding rates steady at 2.15% and the Fed potentially extending cuts into 2026, EUR/USD may test 1.20 if Eurozone growth proves resilient, but weaker growth and an ECB pivot could pull the pair back toward 1.13 and potentially 1.10.
placeholder
My Top 5 Stock Market Predictions for 2026Five 2026 market predictions written in a native, news-style voice: AI’s winners and losers, broader sector leadership, dividend demand, valuation cooling as the Shiller CAPE sits at 39 (Dec. 31, 2025), and quantum-computing bursts—while keeping all original facts and numbers unchanged.
Author  Mitrade
Jan 06, Tue
Five 2026 market predictions written in a native, news-style voice: AI’s winners and losers, broader sector leadership, dividend demand, valuation cooling as the Shiller CAPE sits at 39 (Dec. 31, 2025), and quantum-computing bursts—while keeping all original facts and numbers unchanged.
placeholder
WTI recovers to near $86.50 as Strait of Hormuz remains closedWest Texas Intermediate (WTI), the US crude oil benchmark, is trading around $86.40 during the early Asian trading hours on Tuesday. The WTI price faces extreme volatility following a massive spike to nearly $120 per barrel in the previous session. 
Author  FXStreet
Mar 10, Tue
West Texas Intermediate (WTI), the US crude oil benchmark, is trading around $86.40 during the early Asian trading hours on Tuesday. The WTI price faces extreme volatility following a massive spike to nearly $120 per barrel in the previous session. 
Related Instrument
goTop
quote