

EUR/USD trapped below 1.09 as quiet Monday markets churn
- EUR/USD continued to drift near 1.0900 after a quiet start to the new trading week.
- The Euro is poised for a rebound after paring back gains against the US Dollar.
- Key data due later in the week, data-light sessions expected until then.
EUR/USD churned on Monday just below 1.0900 as the new trading week kicks things off on a notably light note. Meaningful data remains limited for the first half of the trading week, leaving Fiber traders to shuffle in place as investors await Wednesday’s key Purchasing Managers Index (PMI) figures for both the EU and the US.
Forex Today: Key US data prompt some caution
Monday and Tuesday are set to keep things roughly on-balance as markets await a kickstart to the week’s meaningful economic data calendar on Wednesday. On Tuesday, mid-tier US Existing Home Sales Change for June will be released. EUR/USD traders will be focusing on Wednesday’s double-header of Purchasing Managers Index (PMI) data prints. The EU’s Manufacturing and Services PMI for July are expected to slightly increase, with MoM Services PMI numbers projected to be at 53.0 compared to the previous month’s 52.8.
On Wednesday, the US will release its own PMI data. Forecasting models predict that July’s US Services PMI will decrease to 54.4 from the previous 55.3. Thursday will continue with high-impact US data trend, featuring annualized Gross Domestic Product (GDP) for the second quarter of 2024. The trading week will conclude with Friday’s US Personal Consumption Expenditure - Price Index (PCE) inflation, which will provide key US inflation data.
Euro PRICE This week
The table below shows the percentage change of Euro (EUR) against listed major currencies this week. Euro was the strongest against the Australian Dollar.
| USD | EUR | GBP | JPY | CAD | AUD | NZD | CHF | |
|---|---|---|---|---|---|---|---|---|
| USD | -0.06% | -0.14% | -0.31% | 0.32% | 0.69% | 0.64% | 0.20% | |
| EUR | 0.06% | -0.09% | -0.29% | 0.34% | 0.79% | 0.65% | 0.20% | |
| GBP | 0.14% | 0.09% | -0.30% | 0.42% | 0.89% | 0.72% | 0.27% | |
| JPY | 0.31% | 0.29% | 0.30% | 0.67% | 1.08% | 0.92% | 0.46% | |
| CAD | -0.32% | -0.34% | -0.42% | -0.67% | 0.46% | 0.32% | -0.12% | |
| AUD | -0.69% | -0.79% | -0.89% | -1.08% | -0.46% | -0.14% | -0.60% | |
| NZD | -0.64% | -0.65% | -0.72% | -0.92% | -0.32% | 0.14% | -0.41% | |
| CHF | -0.20% | -0.20% | -0.27% | -0.46% | 0.12% | 0.60% | 0.41% |
The heat map shows percentage changes of major currencies against each other. The base currency is picked from the left column, while the quote currency is picked from the top row. For example, if you pick the Euro from the left column and move along the horizontal line to the US Dollar, the percentage change displayed in the box will represent EUR (base)/USD (quote).
EUR/USD technical outlook
EUR/USD traded tightly with near-term technical levels on Monday, cycling just north of the 200-hour Exponential Moving Average (EMA) at 1.0882. The Fiber has pulled back from recent highs set just shy of 1.0950 as Greenback bidding eases further back but the top end remains close by.
Daily candlesticks are poised for an extended backslide as price action slips back into the range of a rough descending channel, and a continued bearish reversal could see bids set up to challenge the 200-day EMA at 1.0795.
EUR/USD hourly chart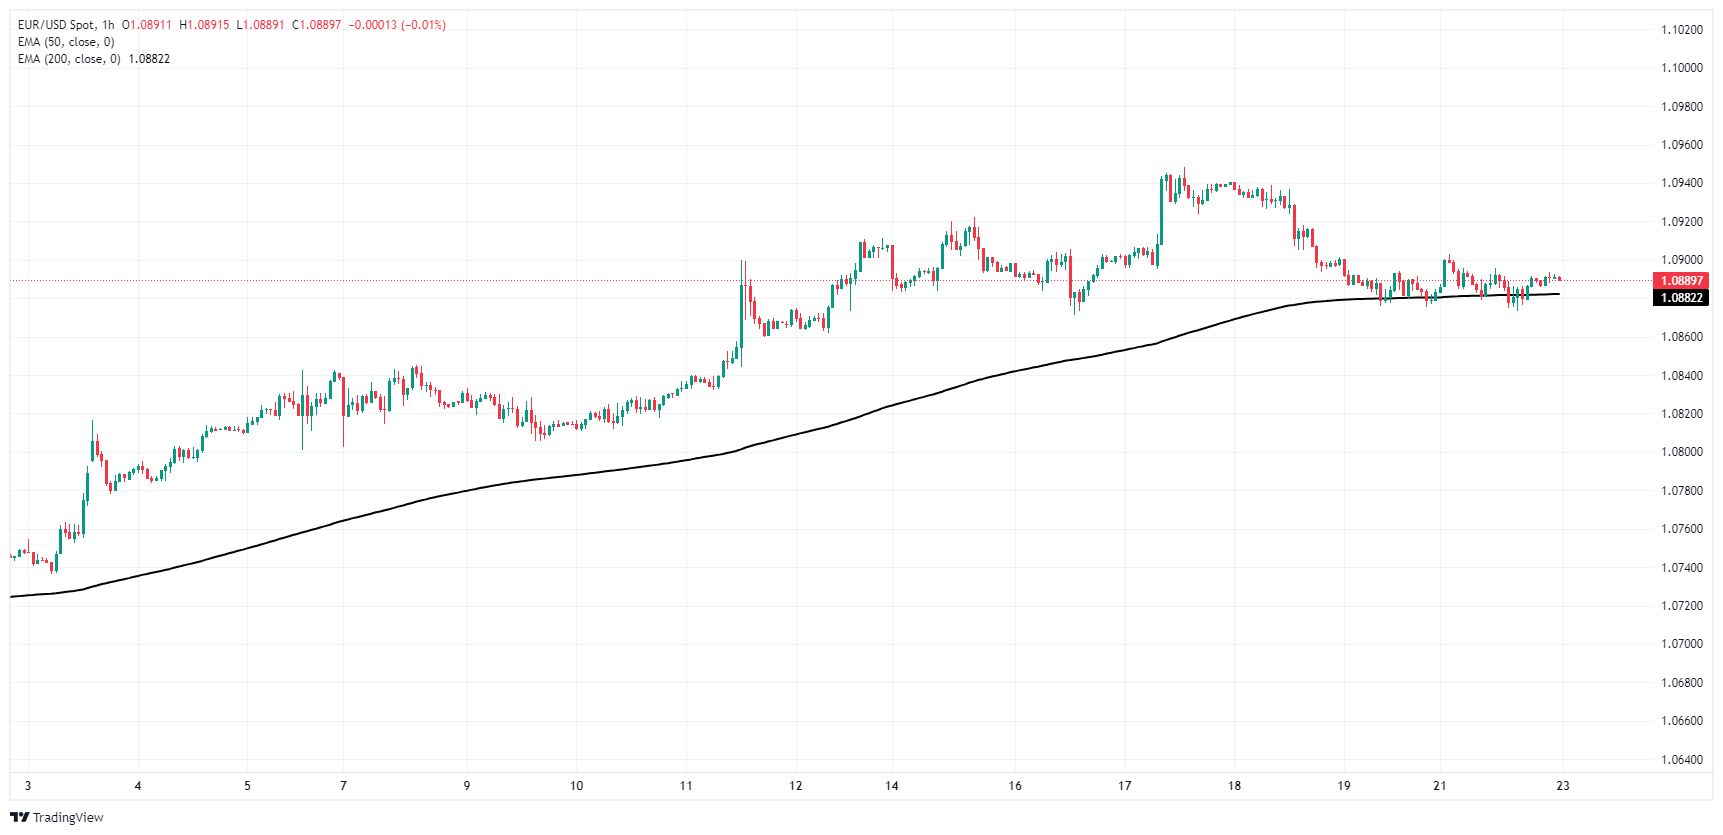
EUR/USD daily chart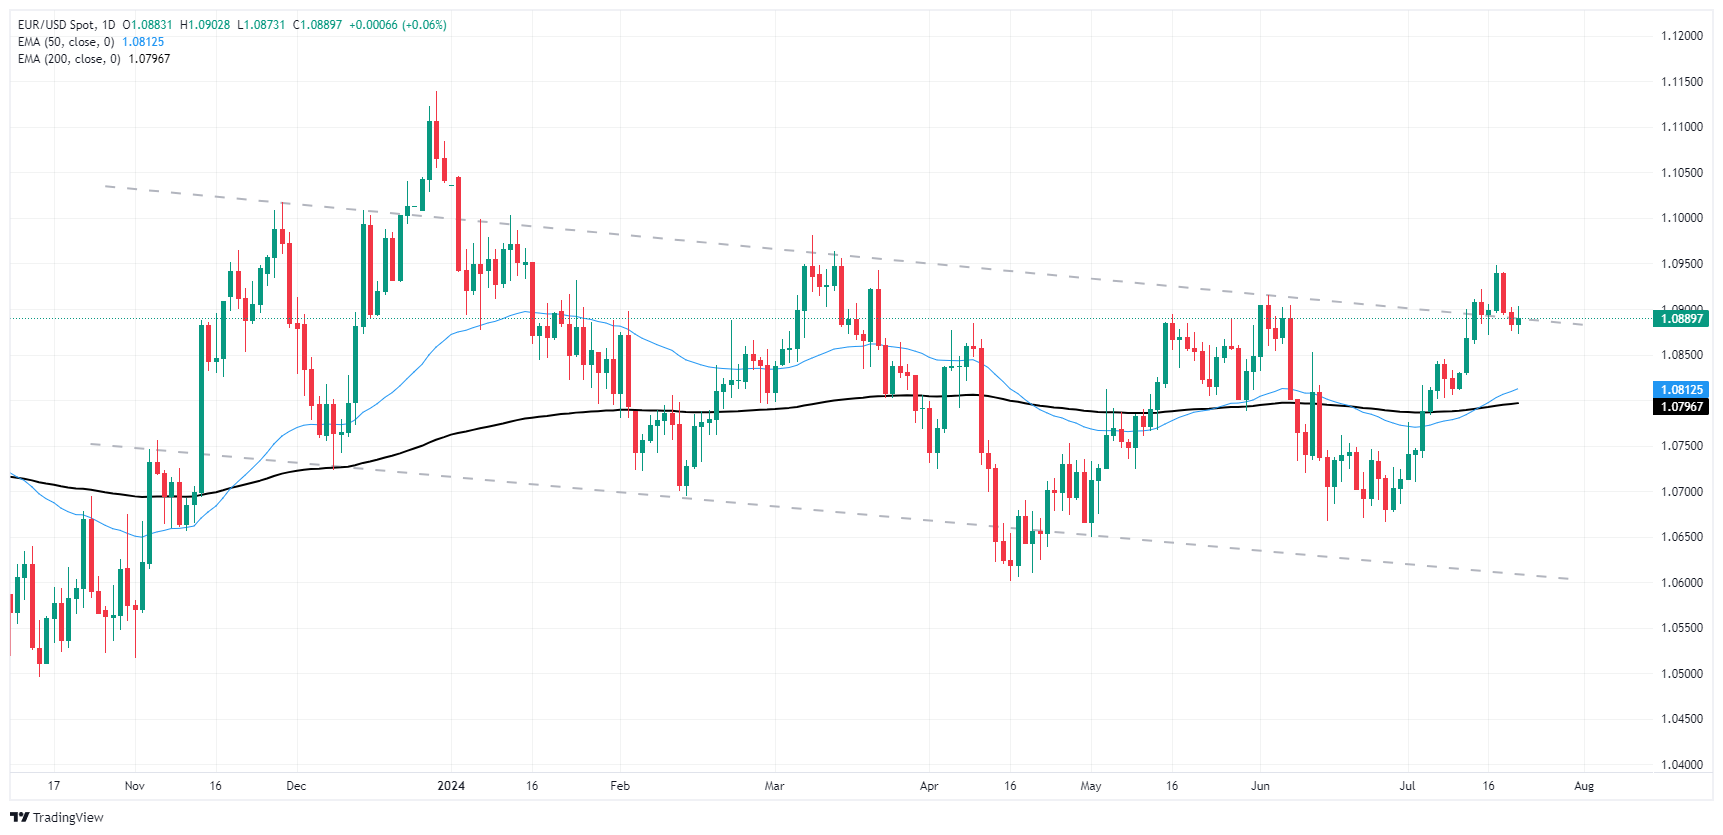
Euro FAQs
The Euro is the currency for the 20 European Union countries that belong to the Eurozone. It is the second most heavily traded currency in the world behind the US Dollar. In 2022, it accounted for 31% of all foreign exchange transactions, with an average daily turnover of over $2.2 trillion a day. EUR/USD is the most heavily traded currency pair in the world, accounting for an estimated 30% off all transactions, followed by EUR/JPY (4%), EUR/GBP (3%) and EUR/AUD (2%).
The European Central Bank (ECB) in Frankfurt, Germany, is the reserve bank for the Eurozone. The ECB sets interest rates and manages monetary policy. The ECB’s primary mandate is to maintain price stability, which means either controlling inflation or stimulating growth. Its primary tool is the raising or lowering of interest rates. Relatively high interest rates – or the expectation of higher rates – will usually benefit the Euro and vice versa. The ECB Governing Council makes monetary policy decisions at meetings held eight times a year. Decisions are made by heads of the Eurozone national banks and six permanent members, including the President of the ECB, Christine Lagarde.
Eurozone inflation data, measured by the Harmonized Index of Consumer Prices (HICP), is an important econometric for the Euro. If inflation rises more than expected, especially if above the ECB’s 2% target, it obliges the ECB to raise interest rates to bring it back under control. Relatively high interest rates compared to its counterparts will usually benefit the Euro, as it makes the region more attractive as a place for global investors to park their money.
Data releases gauge the health of the economy and can impact on the Euro. Indicators such as GDP, Manufacturing and Services PMIs, employment, and consumer sentiment surveys can all influence the direction of the single currency. A strong economy is good for the Euro. Not only does it attract more foreign investment but it may encourage the ECB to put up interest rates, which will directly strengthen the Euro. Otherwise, if economic data is weak, the Euro is likely to fall. Economic data for the four largest economies in the euro area (Germany, France, Italy and Spain) are especially significant, as they account for 75% of the Eurozone’s economy.
Another significant data release for the Euro is the Trade Balance. This indicator measures the difference between what a country earns from its exports and what it spends on imports over a given period. If a country produces highly sought after exports then its currency will gain in value purely from the extra demand created from foreign buyers seeking to purchase these goods. Therefore, a positive net Trade Balance strengthens a currency and vice versa for a negative balance.
Recommended Articles


