

GBP/JPY declines amid speculation of ongoing ‘Yenterventions’ from BoJ
- GBP/JPY tumbled back to 203.00 as markets suspect continued market intervention.
- The Yen soared a full percent against the Pound Sterling on Wednesday.
- This follows last week’s 2% sudden decline and a surge in BoJ spending.
GBP/JPY continued a pattern of sharp declines on Wednesday, tumbling over a full percent on the day as markets continue to suspect further direct intervention spending in an attempt to bolster the battered Yen.
According to reporting by Bloomberg, it is suspected that the Bank of Japan (BoJ) overspent on market operations to the tune of ¥2.14 trillion last Friday after week-on-week current account figures wildly overclocked money broker forecasts. No official statements from Japanese officials are expected, but if Wednesday’s extended downswing and last Friday’s Yen surge were a result of policymakers stepping into FX markets, it would represent the third and fourth instances of Yen defending just in 2024.
The Yen remains a deeply bearish currency that has become a sell-side favorite across the global fx markets. Even the Guppy’s -2.44% five day decline leaves GBP/JPY trading at 16-year highs, and direct market intervention is becoming increasingly expensive for Japan, a country with an already hefty debt ratio.
UK labor data, Japanese national CPI inflation numbers in the barrel
UK Producer Price Index (PPI) figures released early Wednesday did little to support the Pound Sterling with PPI inflation contracting 0.3% MoM in June, down from the previous revised 0.0% and entirely reversing direction on the forecast uptick to 0.1%.
UK labor data is in the barrel for Thursday, which is expected to show a sharp decline in unemployment claims. Claimant Count Change figures in June are forecast to ease to 23.4K from the previous 50.4K, and a misfire in the headline unemployment figure could shred further support for the GBP.
Japanese National Consumer Price Index (CPI) inflation is due on Friday, and while June’s annualized CPI inflation print is expected to tick up to 2.7% from the previous 2.5%, the figure is unlikely to be a strong enough inflation print to spark a topside move in interest rates from the BoJ. Japanese National CPI inflation figures are also forecast by Tokyo CPI inflation data which releases several weeks earlier, so market effects at the print tend to be muted.
GBP/JPY technical outlook
The Guppy tumbled back on Wednesday, falling toward the 203.00 handle amid broad-market strength in the Yen and flipping the pair into the red for the month of July, erasing the month’s gains and dragging bids down nearly 2.5% from July’s 16-year peak of 208.11.
A thin near-term consolidation range near 205.50 could provide an intraday technical support level for bids if they continue to circle the drain, but downside momentum still sees significant upside pressure. Daily candlesticks are still soaring well above the 200-day Exponential Moving Average (EMA) at 192.07, and bids would still need to drop another 0.8% before even coming within range of the 50-day EMA at 201.29.
GBP/JPY hourly chart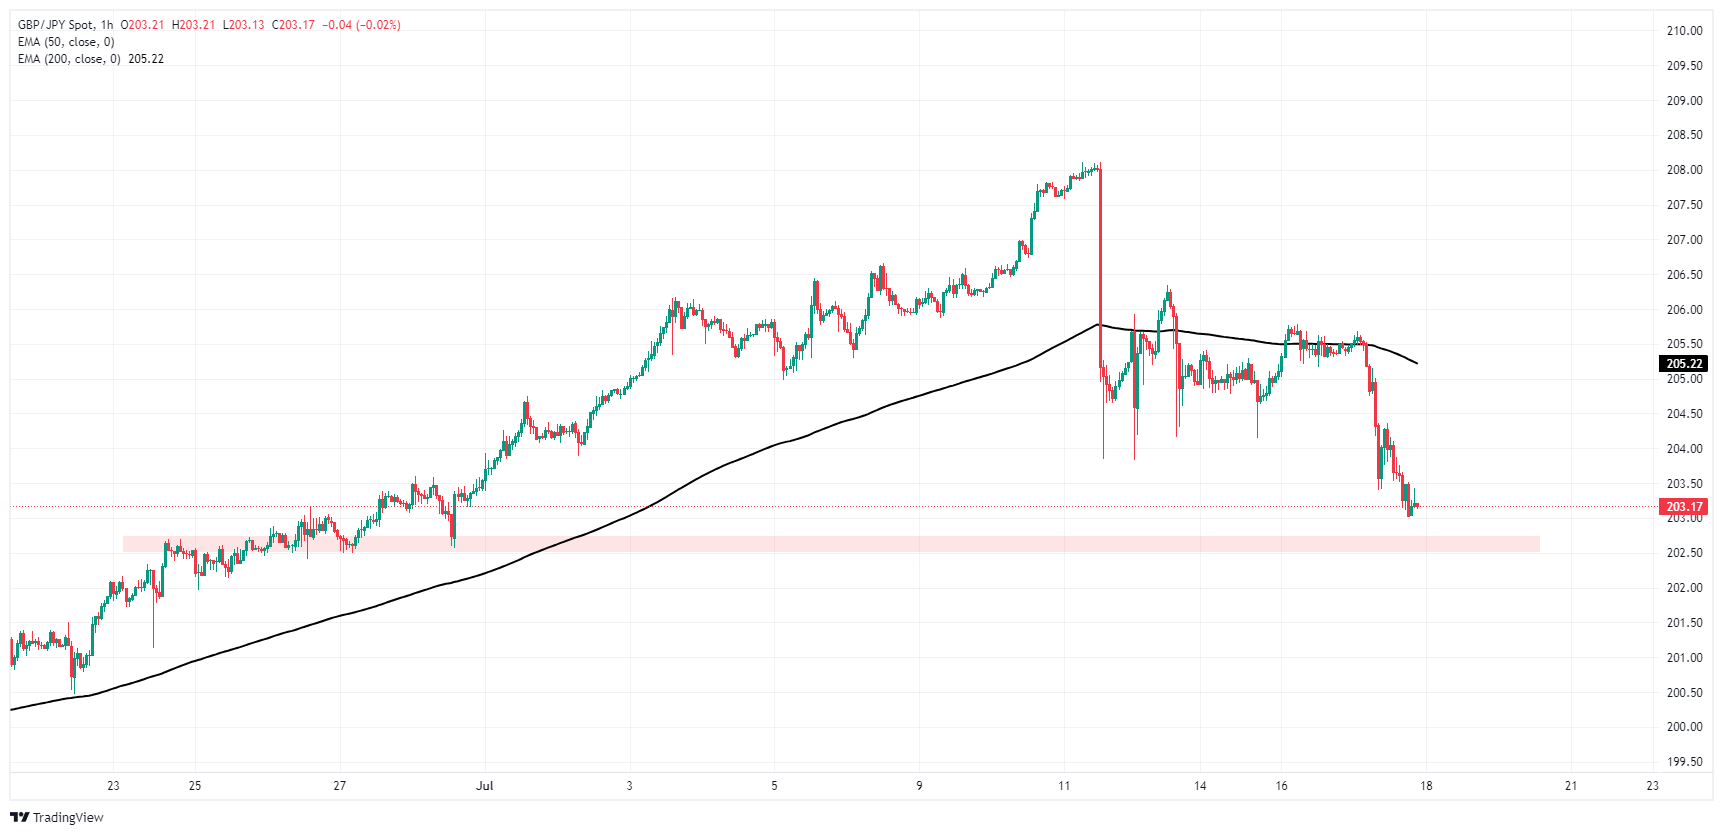
GBP/JPY daily chart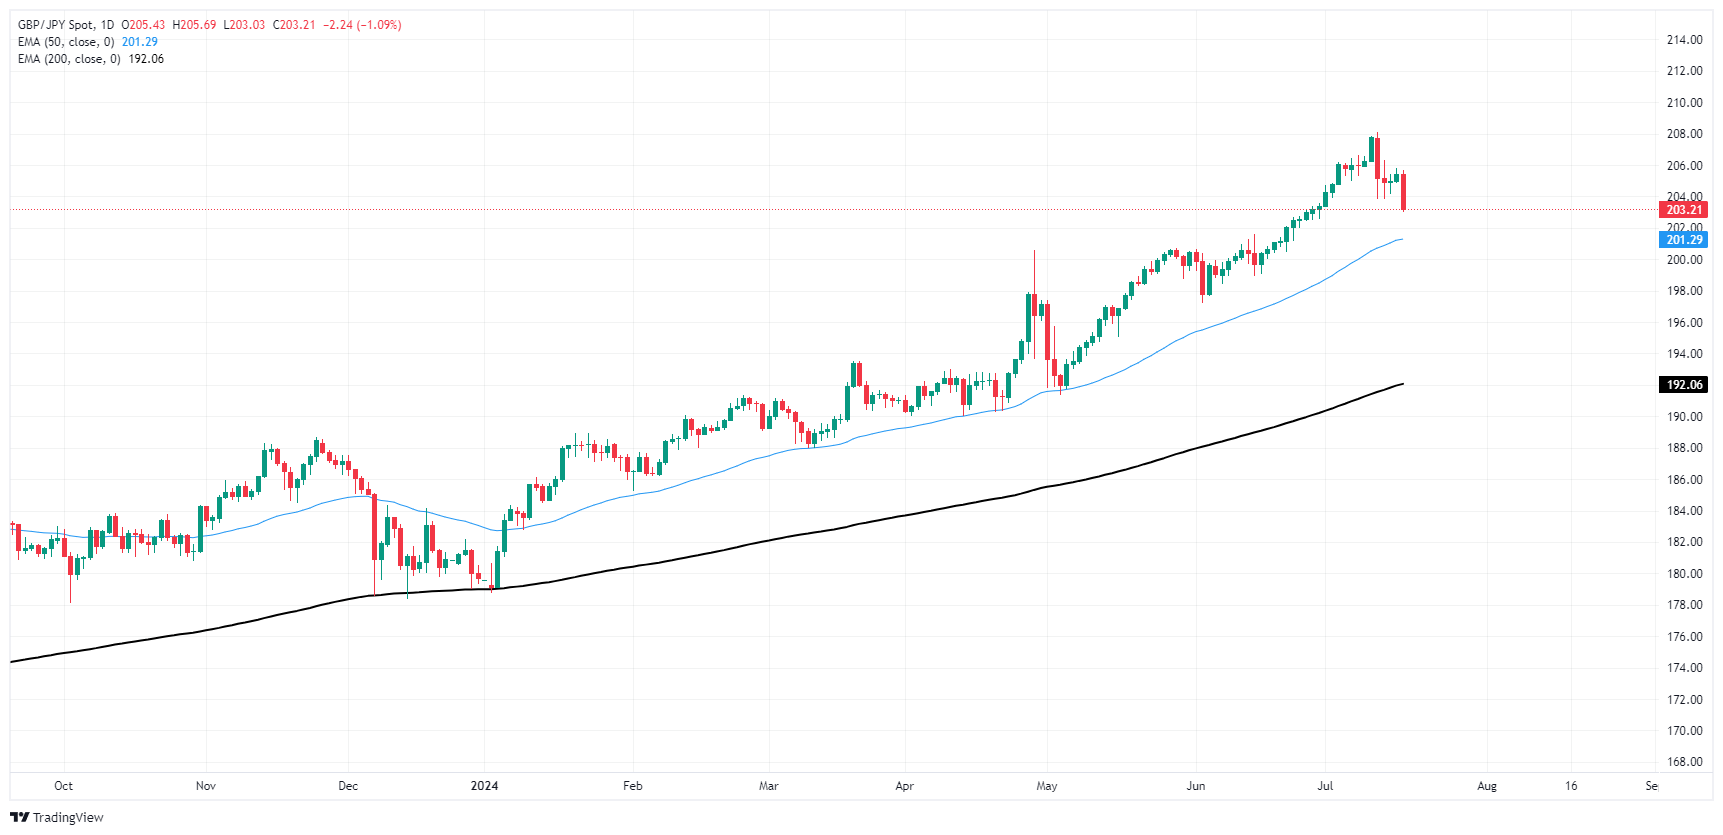
Japanese Yen FAQs
The Japanese Yen (JPY) is one of the world’s most traded currencies. Its value is broadly determined by the performance of the Japanese economy, but more specifically by the Bank of Japan’s policy, the differential between Japanese and US bond yields, or risk sentiment among traders, among other factors.
One of the Bank of Japan’s mandates is currency control, so its moves are key for the Yen. The BoJ has directly intervened in currency markets sometimes, generally to lower the value of the Yen, although it refrains from doing it often due to political concerns of its main trading partners. The current BoJ ultra-loose monetary policy, based on massive stimulus to the economy, has caused the Yen to depreciate against its main currency peers. This process has exacerbated more recently due to an increasing policy divergence between the Bank of Japan and other main central banks, which have opted to increase interest rates sharply to fight decades-high levels of inflation.
The BoJ’s stance of sticking to ultra-loose monetary policy has led to a widening policy divergence with other central banks, particularly with the US Federal Reserve. This supports a widening of the differential between the 10-year US and Japanese bonds, which favors the US Dollar against the Japanese Yen.
The Japanese Yen is often seen as a safe-haven investment. This means that in times of market stress, investors are more likely to put their money in the Japanese currency due to its supposed reliability and stability. Turbulent times are likely to strengthen the Yen’s value against other currencies seen as more risky to invest in.
Recommended Articles


