EUR/USD Price Analysis: Rises to 1.0850; next barrier at upper boundary of triangle

Source Fxstreet
  • The EUR/USD pair could retest the upper boundary of the ascending triangle, followed by a key level of 1.0900.
  • Based on a technical analysis of the daily chart, there appears to be a bullish bias for the pair.
  • Immediate support is observed at the 21-day EMA at 1.0819, followed by the psychological level of 1.0800.

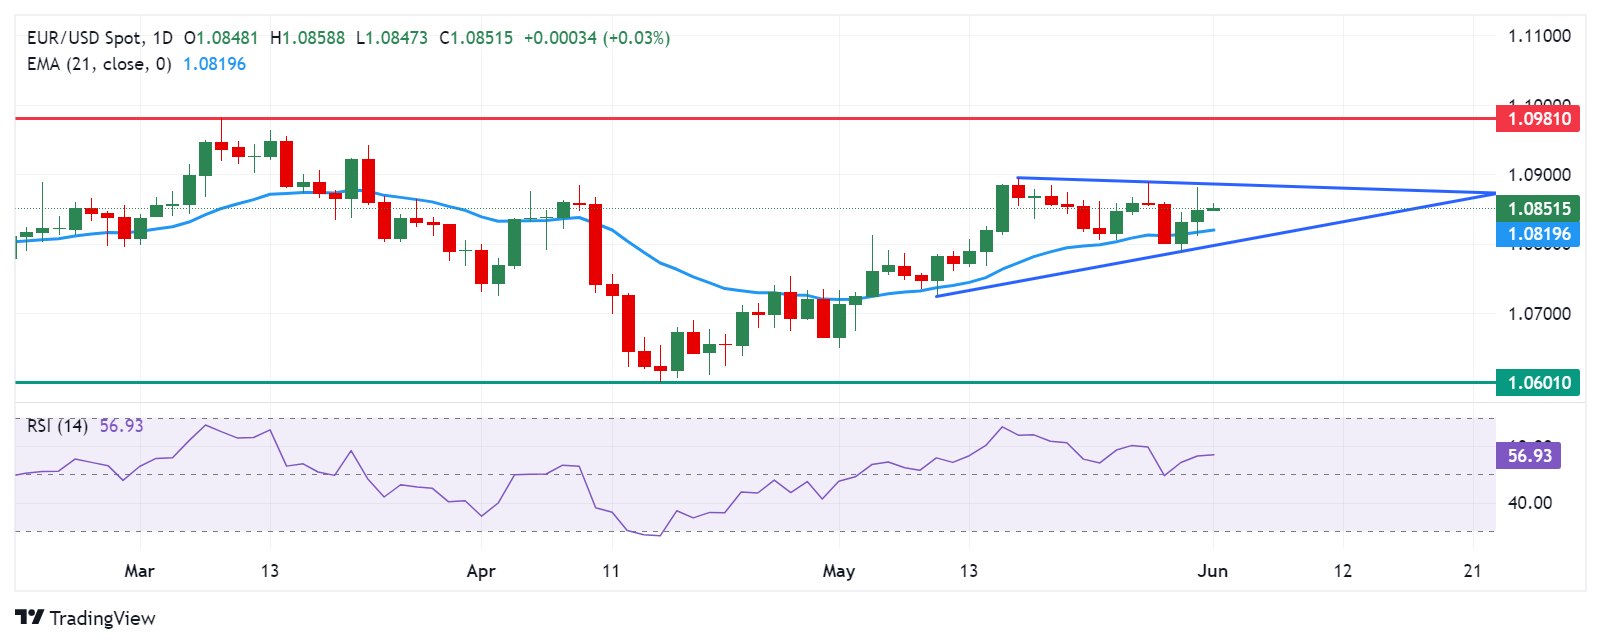
EUR/USD extends its gains for the third straight day, trading around 1.0850 during the Asian session on Monday. A technical analysis of a daily chart suggests a bullish bias for the pair, as it moves upward within the ascending triangle. Additionally, the momentum indicator 14-day Relative Strength Index (RSI) is positioned above the 50 level, confirming a bullish bias.

The EUR/USD pair could retest the upper boundary of the ascending triangle, followed by the psychological level of 1.0900. A breakthrough above the latter could support the pair to explore the region around March’s high of 1.0981.

On the downside, immediate support is seen at the 21-day Exponential Moving Average (EMA) at 1.0819, followed by the psychological level of 1.0800 nearing the lower threshold of the ascending triangle.

If the EUR/USD pair breaks below the lower boundary of the ascending triangle, it could face downward pressure, potentially descending toward the vicinity of the notable level of 1.0700. Additional support is likely to be found at the throwback support level around 1.0601.

EUR/USD: Daily Chart

EUR/USD

Overview
Today last price 1.0852
Today Daily Change 0.0004
Today Daily Change % 0.04
Today daily open 1.0848
 
Trends
Daily SMA20 1.0822
Daily SMA50 1.0773
Daily SMA100 1.0808
Daily SMA200 1.0788
 
Levels
Previous Daily High 1.0882
Previous Daily Low 1.0811
Previous Weekly High 1.0889
Previous Weekly Low 1.0788
Previous Monthly High 1.0895
Previous Monthly Low 1.065
Daily Fibonacci 38.2% 1.0855
Daily Fibonacci 61.8% 1.0838
Daily Pivot Point S1 1.0812
Daily Pivot Point S2 1.0776
Daily Pivot Point S3 1.0741
Daily Pivot Point R1 1.0883
Daily Pivot Point R2 1.0918
Daily Pivot Point R3 1.0954


Disclaimer: For information purposes only. Past performance is not indicative of future results.
placeholder
Nvidia 2026 Shareholder Meeting Preview: Can Stock Price Hit New Highs? How Blackwell, Vera Production Ramps Will Determine Future Revenue?This Wednesday (June 24), NVIDIA (NVDA) will hold its 2026 annual meeting of stockholders online. The focus of this meeting will be the production ramp-up of Blackwell and the brand-new V
Author  TradingKey
6 hours ago
This Wednesday (June 24), NVIDIA (NVDA) will hold its 2026 annual meeting of stockholders online. The focus of this meeting will be the production ramp-up of Blackwell and the brand-new V
placeholder
Morgan Stanley’s Latest Assessment: Three Variables for Gold’s Rise to $5,200 — Hawkish Fed, ETF Flows, and Middle East TurmoilMorgan Stanley ( MS )'s latest precious metals research report shows that while continuous gold purchases by global central banks have provided a solid floor of support, gold ( XAUUSD )'s
Author  TradingKey
7 hours ago
Morgan Stanley ( MS )'s latest precious metals research report shows that while continuous gold purchases by global central banks have provided a solid floor of support, gold ( XAUUSD )'s
placeholder
Qatar and Pakistan: High-level committee agrees on roadmap to final deal within 60 daysThe US-Iran peace talks took place on Sunday in Bürgenstock, Switzerland, with delegations from Iran, the United States, Qatar, and Pakistan participating.
Author  FXStreet
14 hours ago
The US-Iran peace talks took place on Sunday in Bürgenstock, Switzerland, with delegations from Iran, the United States, Qatar, and Pakistan participating.
placeholder
Silver Price Forecast: XAG/USD rebounds to near $66.00 amid fading US-Iran talks optimismSilver price (XAG/USD) halts its three-day losing streak, trading around $65.90 per troy ounce during the Asian hours on Monday.
Author  FXStreet
15 hours ago
Silver price (XAG/USD) halts its three-day losing streak, trading around $65.90 per troy ounce during the Asian hours on Monday.
placeholder
WTI Price Forecast: Trades above $75.50 on Iran uncertainty; 200-day SMA holds the keyWest Texas Intermediate (WTI) – the benchmark US Crude Oil price – struggles to capitalize on the overnight bounce from the $72.80 region, or the lowest level since early March, and oscillates in a narrow band during the Asian session on Friday.
Author  FXStreet
Jun 19, Fri
West Texas Intermediate (WTI) – the benchmark US Crude Oil price – struggles to capitalize on the overnight bounce from the $72.80 region, or the lowest level since early March, and oscillates in a narrow band during the Asian session on Friday.
Related Instrument
goTop
quote