AUD/JPY Price Analysis: Hits two-week low, yet regain 104.00

Source Fxstreet
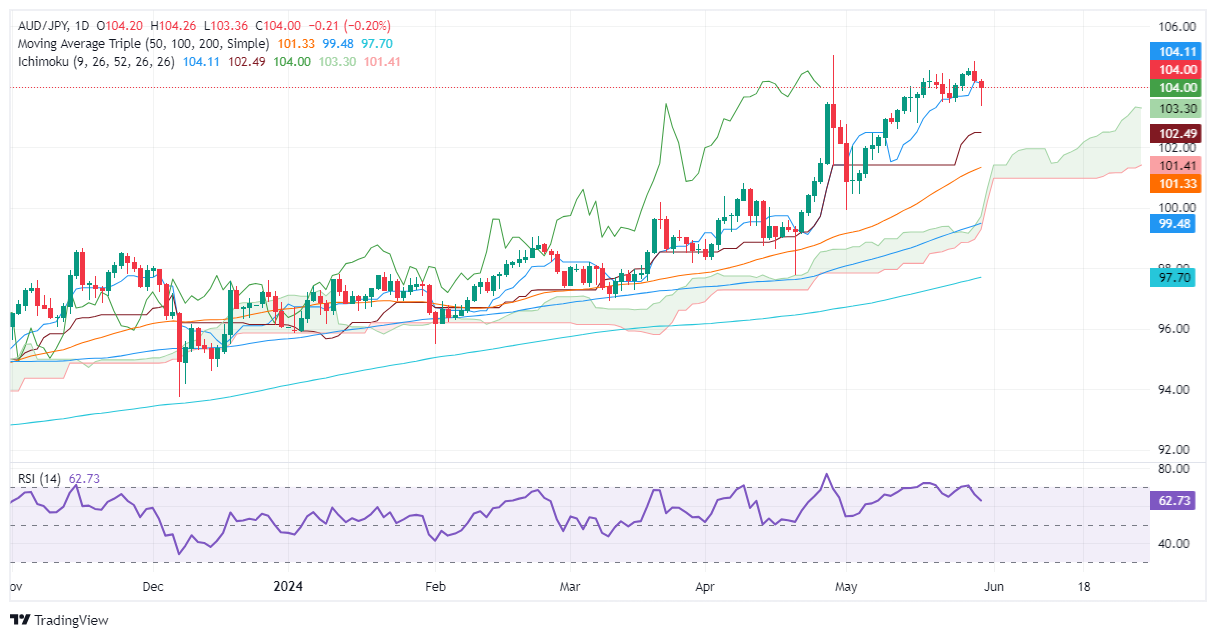
  • AUD/JPY registers losses, hitting a two-week low of 103.89 before stabilizing at 104.00.
  • Technical outlook shows upward bias, but recent 'evening star' pattern indicates potential for further downside.
  • Key levels to watch: Resistance at 104.50 and 104.94 YTD high; support at 103.27 (Senkou Span A) and 102.42 (Kijun-Sen).

The Australian Dollar registered modest losses of around 0.17% against the Japanese Yen on Thursday and slipped below 104.00 to hit a two-week low of 103.89. As Friday’s Asian session begins, the AUD/JPY trades at 104.00, virtually flat.

AUD/JPY Price Analysis: Technical outlook

The pair is upward biased as shown by the daily chart, yet it remains shy of cracking the current year-to-date (YTD) high of 104.94. Three days ago, the AUD/JPY climbed sharply toward 104.84, but buyers were unable to continue to push prices higher, finishing the session in the red.

That formed a two-candle chart pattern called an ‘evening star’, pushing the exchange rate lower on Thursday, but buyers ultimately regained control.

From a momentum standpoint, the Relative Strength Index (RSI) shows that bulls are in charge.

That said, the AUD/JPY's next resistance level would be 104.50, followed by the YTD high at 104.94. Conversely, if the cross extends its losses past Thursday’s low of 103.89, that could exacerbate the pair’s downfall toward the Senkou Span A support level at 103.27 before challenging the Kijun-Sen at 102.42.

AUD/JPY Price Action – Daily Chart
AUD/JPY

Overview
Today last price 104.02
Today Daily Change -0.19
Today Daily Change % -0.18
Today daily open 104.21
 
Trends
Daily SMA20 103.28
Daily SMA50 101.24
Daily SMA100 99.41
Daily SMA200 97.65
 
Levels
Previous Daily High 104.87
Previous Daily Low 104.12
Previous Weekly High 104.56
Previous Weekly Low 103.48
Previous Monthly High 105.04
Previous Monthly Low 97.78
Daily Fibonacci 38.2% 104.4
Daily Fibonacci 61.8% 104.58
Daily Pivot Point S1 103.93
Daily Pivot Point S2 103.65
Daily Pivot Point S3 103.18
Daily Pivot Point R1 104.68
Daily Pivot Point R2 105.15
Daily Pivot Point R3 105.43


Disclaimer: For information purposes only. Past performance is not indicative of future results.
placeholder
Bitcoin Price Bounces Back—Can It Finally Break Resistance?Bitcoin price started a recovery wave above the $83,500 zone. BTC is now consolidating and might struggle to settle above the $85,500 zone. Bitcoin started a decent recovery wave above the $83,500
Author  NewsBTC
Apr 02, Wed
Bitcoin price started a recovery wave above the $83,500 zone. BTC is now consolidating and might struggle to settle above the $85,500 zone. Bitcoin started a decent recovery wave above the $83,500
placeholder
U.S. March Nonfarm Payroll Preview: Even If Data Aligns with Expectations, Financial Markets May Not Escape the Fate of VolatilityOn 4 April 2025, the United States will release its March Nonfarm Payrolls (NFP) data. The market consensus currently anticipates job growth of 128,000, a decline from February’s 151,000 (Figure 1). W
Author  TradingKey
Apr 02, Wed
On 4 April 2025, the United States will release its March Nonfarm Payrolls (NFP) data. The market consensus currently anticipates job growth of 128,000, a decline from February’s 151,000 (Figure 1). W
placeholder
Japanese Yen spikes to multi-week high against USD after Trump’s tariffs announcementThe Japanese Yen (JPY) jumped to a three-week top against its American counterpart during the Asian session on Thursday after US President Donald Trump imposed sweeping trade tariffs.
Author  FXStreet
22 hours ago
The Japanese Yen (JPY) jumped to a three-week top against its American counterpart during the Asian session on Thursday after US President Donald Trump imposed sweeping trade tariffs.
placeholder
Bitcoin price reacts as Gold sets fresh record highs after Trump’s reciprocal tariffs announcementBitcoin price plunges towards $82,000 as Gold soars past $3,150 after US President Donald Trump imposed new tariffs on Israel and UK, triggering global markets turbulence.
Author  FXStreet
22 hours ago
Bitcoin price plunges towards $82,000 as Gold soars past $3,150 after US President Donald Trump imposed new tariffs on Israel and UK, triggering global markets turbulence.
placeholder
Bitcoin Price Forecast: Tariff volatility sweeps over $200 billion from crypto marketsBitcoin (BTC) price hovers around $83,000 at the time of writing on Thursday after it failed to close above a critical resistance level the previous day.
Author  FXStreet
15 hours ago
Bitcoin (BTC) price hovers around $83,000 at the time of writing on Thursday after it failed to close above a critical resistance level the previous day.
Related Instrument
goTop
quote