
When is the US ISM Services PMI data and how could it affect EUR/USD
- The US ISM Services PMI is expected to show a slight slowdown in business activity in November.
- Investors will be particularly attentive to the employment and prices paid sub-indexes.
- The US Dollar would need a positive surprise in the ISM Services PMI to ease the current bearish pressure.
The United States (US) Institute of Supply Management (ISM) will release its Services Purchasing Managers’ Index (PMI) data for November on Wednesday at 15:00 GMT.
Traders will be attentive to the Services PMI release to assess the overall conditions of the US services sector, a key contributor to the US Gross Domestic Product (GDP). The ISM is expected to show that the Services PMI eased to 52.1 from October’s 52.4, yet still at levels consistent with healthy growth in the sector’s business activity. If the expectations are confirmed, November will be the second consecutive month of growth in the ISM Services PMI, after stalling at 50.0 in September. PMI figures below that level signal contraction of the sector’s activity.
Beyond the PMI reading, investors will be attentive to the rate sub-indexes, namely the Employment Index, which has been contracting for the past five months, fuelling concerns about the deterioration of the US labour market. The Prices Paid Index, which reveals inflationary trends in the sector, and the New Orders Index, which shows the prospects for upcoming activity, will also be carefully analysed.
How could US ISM Manufacturing PMI affect EUR/USD?
The EUR/USD has been rallying continuously for the last 8 trading days and is nearly 1.2% up from mid-November lows. Price action has broken the top of the descending channel from early October highs, at 1.1605, and technical indicators are pointing up.
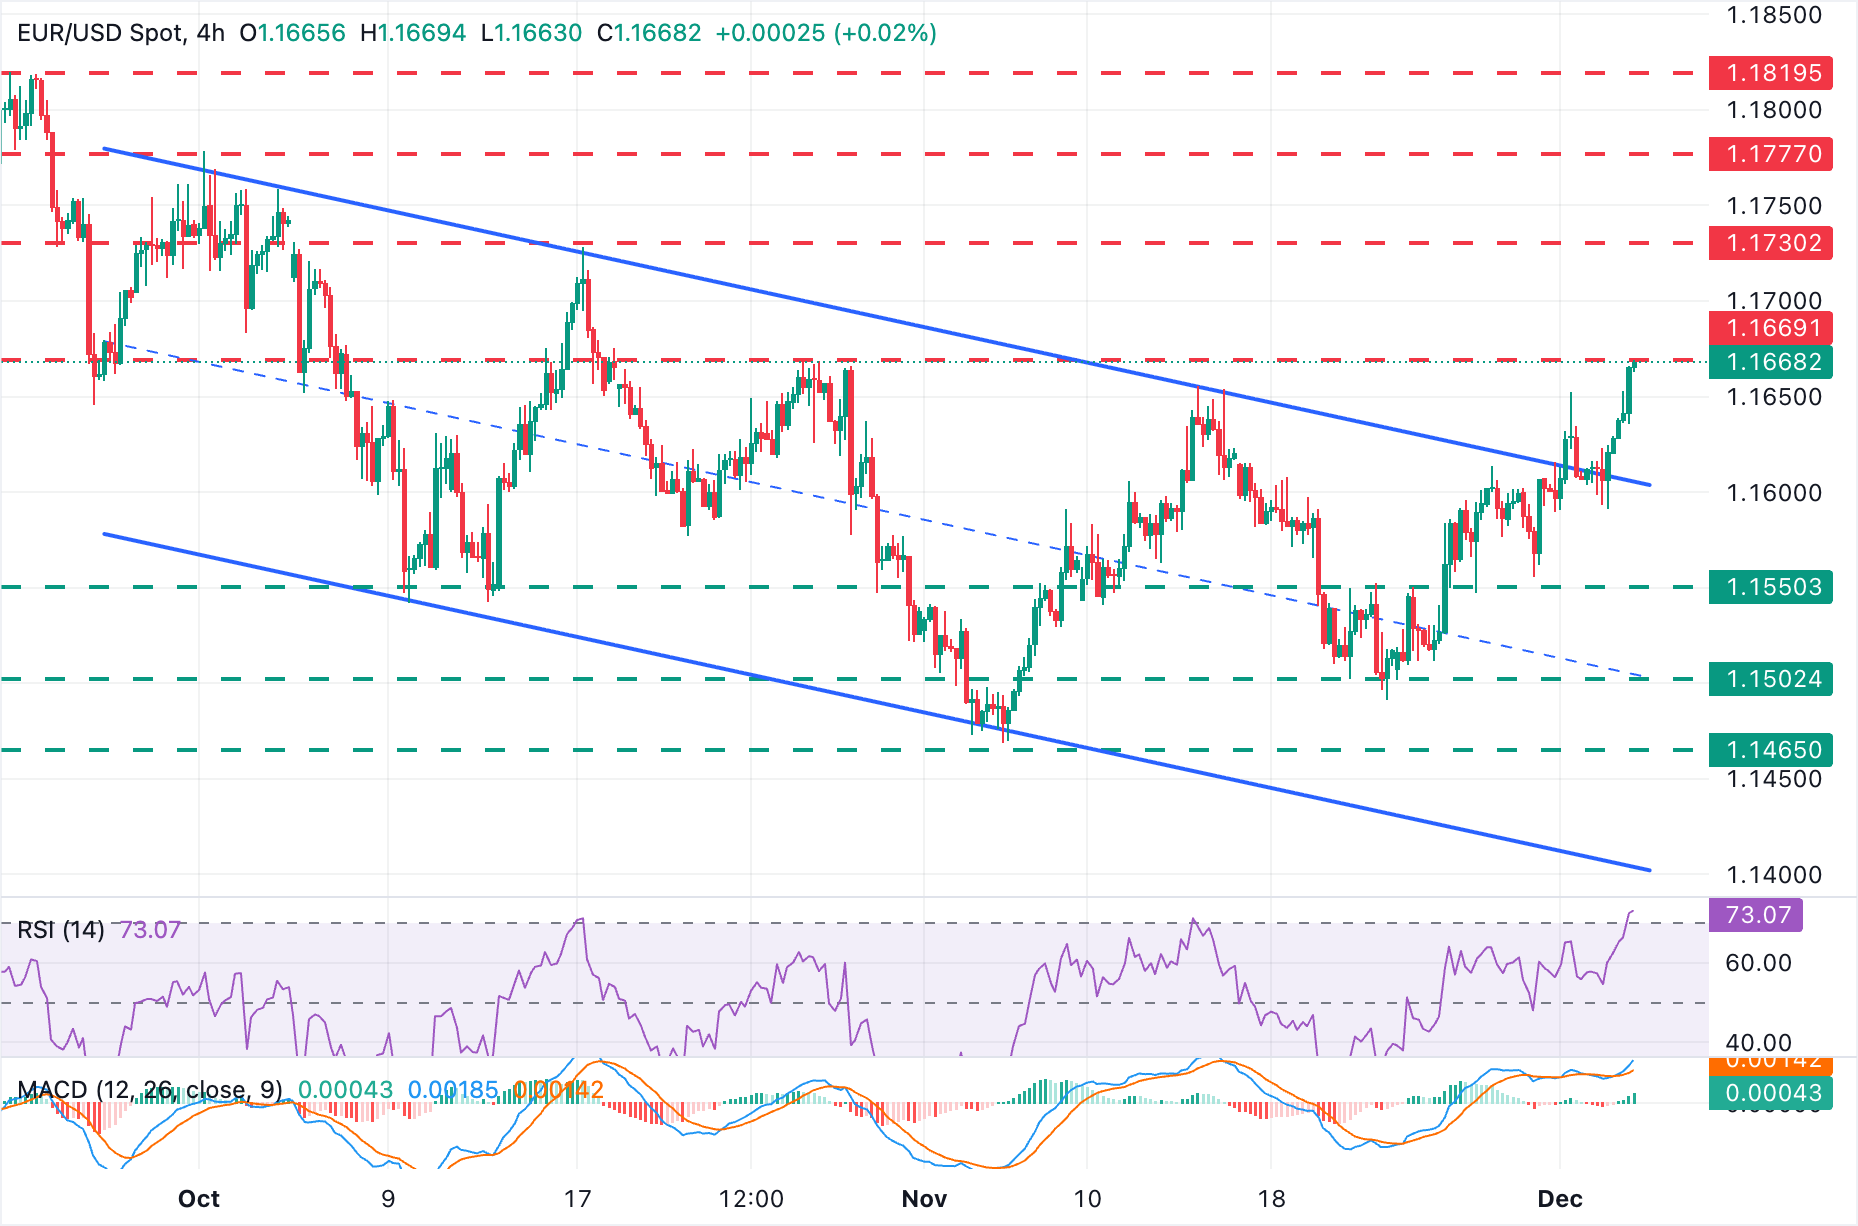
The 4-Hour Moving Average Convergence Divergence (MACD) is rising from the zero line, indicating growing bullish momentum. The Relative Strength Index (RSI), however, has reached overbought levels, which reveals an overstretched market. Bearish attempts, however, are likely to find buyers.
Against this background, the US Dollar would need a positive surprise in the ISM Services PMI, preferably with an unlikely increase in the employment gauge, to regain some of the ground lost over the last few days.
Otherwise, the EUR/USD is expected to maintain its bullish trend, supported by ECB-Fed monetary policy divergence. Bulls are likely to meet resistance at the 1.1660-1.1670 area, which capped rallies in late October and mid-November. A confirmation above here will bring the October 17 high, near 1.1730, into focus.
Downside attempts, on the contrary, are likely to be challenged at the reverse trendline, now at 1.1605. A bearish reaction beyond that level would give bears confidence to retest Tuesday's low at 1.1590 ahead of the 1.1550 area (near November 26 and 28 lows).
Economic Indicator
ISM Services PMI
The Institute for Supply Management (ISM) Services Purchasing Managers Index (PMI), released on a monthly basis, is a leading indicator gauging business activity in the US services sector, which makes up most of the economy. The indicator is obtained from a survey of supply executives across the US based on information they have collected within their respective organizations. Survey responses reflect the change, if any, in the current month compared to the previous month. A reading above 50 indicates that the services economy is generally expanding, a bullish sign for the US Dollar (USD). A reading below 50 signals that services sector activity is generally declining, which is seen as bearish for USD.
Read more.Next release: Wed Dec 03, 2025 15:00
Frequency: Monthly
Consensus: 52.1
Previous: 52.4
Source: Institute for Supply Management
The Institute for Supply Management’s (ISM) Services Purchasing Managers Index (PMI) reveals the current conditions in the US service sector, which has historically been a large GDP contributor. A print above 50 shows expansion in the service sector’s economic activity. Stronger-than-expected readings usually help the USD gather strength against its rivals. In addition to the headline PMI, the Employment Index and the Prices Paid Index numbers are also watched closely by investors as they provide useful insights regarding the state of the labour market and inflation.
Economic Indicator
ISM Services Employment Index
The ISM Non-Manufacturing PMI released by the Institute for Supply Management (ISM) shows business conditions in the US non-manufacturing sector, taking into account expectations for future production, new orders, inventories, employment and deliveries. It is a significant indicator of the overall economic condition in the US. The ISM Services Employment Index represents business sentiment regarding labor market conditions and is considered a strong Non-Farm Payrolls leading indicator. A result above 50 is positive (or bullish) for the USD.
Read more.Next release: Wed Dec 03, 2025 15:00
Frequency: Monthly
Consensus: -
Previous: 48.2
Source: Institute for Supply Management
Recommended Articles


