NZD/JPY Price Analysis: Bullish momentum eases, buyers and sellers find consolidation

Source Fxstreet
  • The daily chart escapes overbought signals as the overall trend begins to consolidate.
  • After reaching multi-year highs above 96.70, NZD/JPY enters a phase of consolidation with support found at 95.50.
  • The 95.00 offers strong support to prevent further losses.

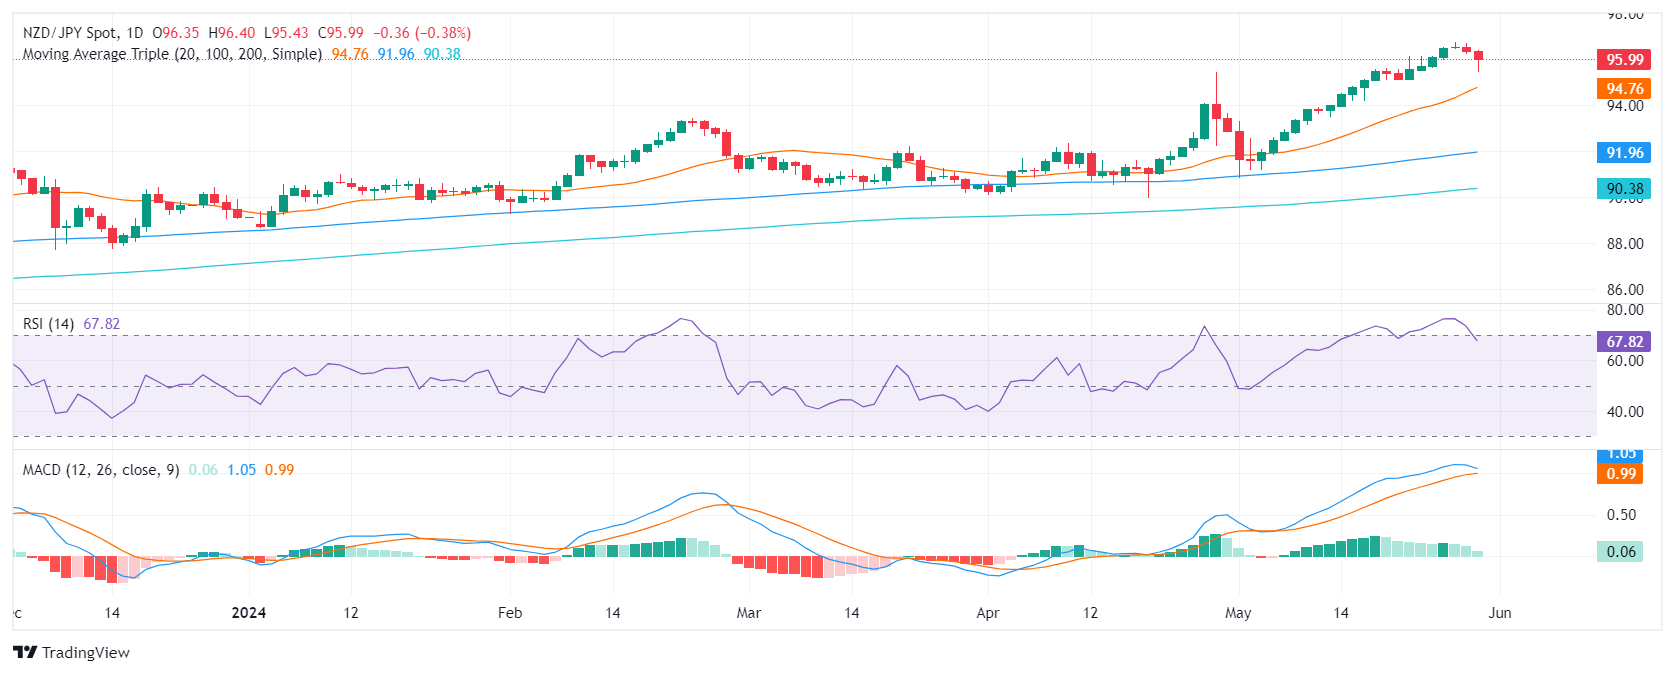
On Thursday's trading session, the NZD/JPY pair underwent further corrections, with sellers gaining momentum. Nonetheless, the pair managed to clear some losses and found strong support at 95.50. Traders are also eying the 95.00 threshold to prevent further losses. While signs of a possible reversal in momentum have waned, the overall outlook remains a phase of consolidation.

According to the daily chart indicators, the Relative Strength Index (RSI) now stands below 70, reflecting a change from previous overbought conditions. This coincides with a potential pause or slow in price gains. Simultaneously, the Moving Average Convergence Divergence (MACD) indicates a decrease in positive momentum with shrinking green bars.

NZD/JPY daily chart
Glancing at the hourly chart, the RSI and MACD histograms have both flattened in negative territory. This suggests that sellers may be losing traction on an hourly basis, indicating consolidation.

NZD/JPY hourly chart
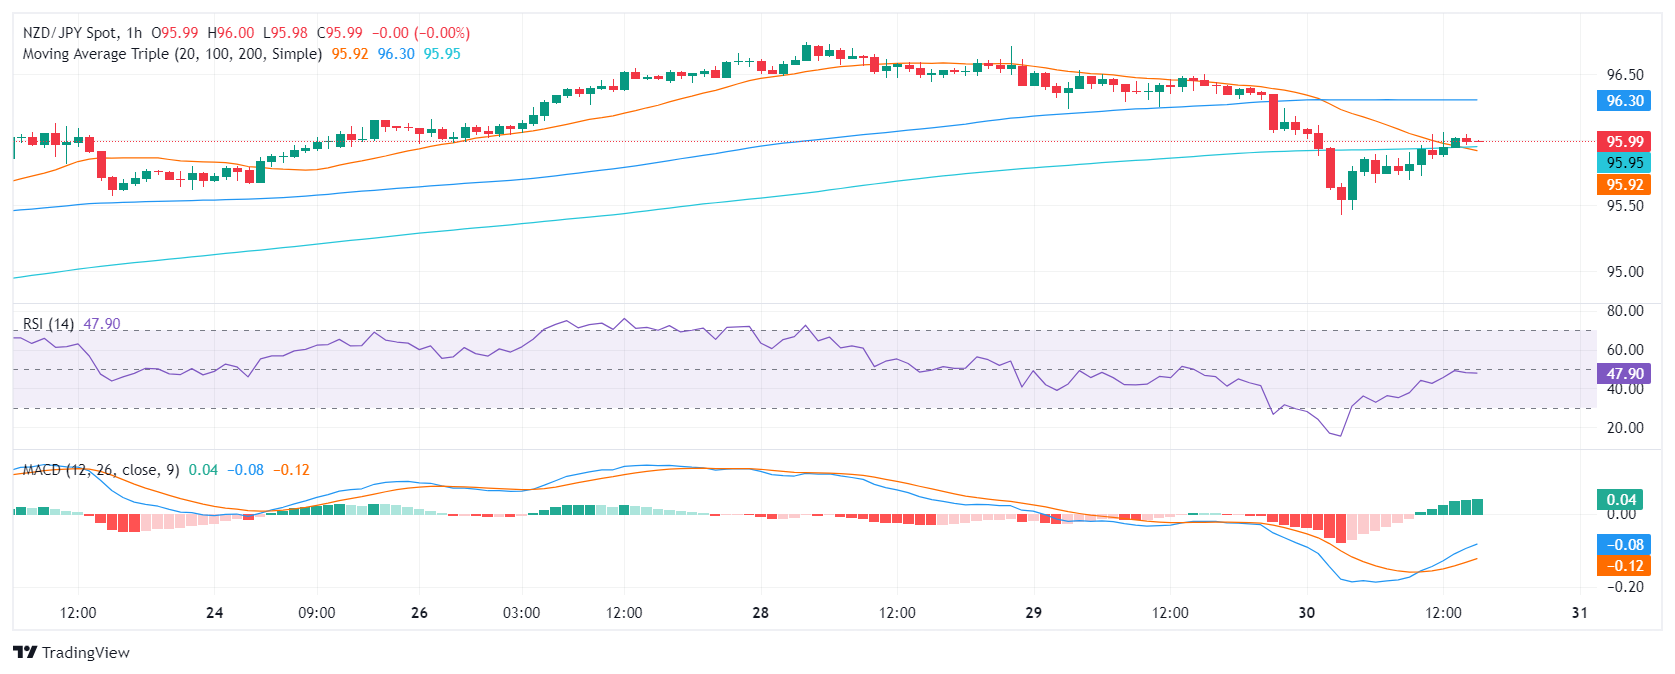
As the consolidation phase continues, any downward movements that keep the pair above its Simple Moving Averages (SMAs) could be considered corrective, providing the pair stays above the key support level of 95.00.

NZD/JPY

Overview
Today last price 95.99
Today Daily Change -0.36
Today Daily Change % -0.37
Today daily open 96.35
 
Trends
Daily SMA20 94.54
Daily SMA50 92.7
Daily SMA100 91.9
Daily SMA200 90.33
 
Levels
Previous Daily High 96.71
Previous Daily Low 96.24
Previous Weekly High 96.15
Previous Weekly Low 95.08
Previous Monthly High 95.42
Previous Monthly Low 89.96
Daily Fibonacci 38.2% 96.42
Daily Fibonacci 61.8% 96.53
Daily Pivot Point S1 96.15
Daily Pivot Point S2 95.96
Daily Pivot Point S3 95.68
Daily Pivot Point R1 96.63
Daily Pivot Point R2 96.91
Daily Pivot Point R3 97.1


Disclaimer: For information purposes only. Past performance is not indicative of future results.
placeholder
Bitcoin volatility drops to third-lowest level since 2012 amid rise in BTC treasury companiesBitcoin (BTC) trades above $108,000 on Tuesday following a steady decline in its volatility in the first half of the year, marking the third-lowest H1 volatility since 2012.
Author  FXStreet
Yesterday 02: 11
Bitcoin (BTC) trades above $108,000 on Tuesday following a steady decline in its volatility in the first half of the year, marking the third-lowest H1 volatility since 2012.
placeholder
AUD/NZD inches higher to near 1.0900 as RBNZ maintains Official Cash Rate at 3.25%AUD/NZD holds ground after the Reserve Bank of New Zealand (RBNZ) decided to stand pat on the policy rate after six consecutive cuts, trading around 1.0890 during the Asian hours on Wednesday.
Author  FXStreet
Yesterday 03: 03
AUD/NZD holds ground after the Reserve Bank of New Zealand (RBNZ) decided to stand pat on the policy rate after six consecutive cuts, trading around 1.0890 during the Asian hours on Wednesday.
placeholder
Ethereum Price Turns Positive — More Upside Likely if Momentum HoldsETH is now consolidating gains and might aim for a fresh move above $2,620.
Author  NewsBTC
Yesterday 03: 26
ETH is now consolidating gains and might aim for a fresh move above $2,620.
placeholder
Jeff Bezos sold nearly 3 million Amazon shares for $665.8 million in early JulyJeff Bezos has sold nearly three million shares of Amazon in the first two days of July, offloading a total of $665.8 million.
Author  Cryptopolitan
Yesterday 03: 43
Jeff Bezos has sold nearly three million shares of Amazon in the first two days of July, offloading a total of $665.8 million.
placeholder
Gold price slides further below $3,300, over one-week low amid a firmer USDGold price (XAU/USD) trades with a negative bias below the $3,300 mark during the Asian session on Wednesday and drops to a one-and-a-half-week low in the last week.
Author  FXStreet
22 hours ago
Gold price (XAU/USD) trades with a negative bias below the $3,300 mark during the Asian session on Wednesday and drops to a one-and-a-half-week low in the last week.
Related Instrument
goTop
quote