


NZD/USD Price Forecast: Advance stalls at SMA clusters, bulls eye 0.59
- NZD/USD stalls near 50- and 200-day SMA resistance zone.
- RSI turns bullish, signaling buyers are gaining momentum again.
- Break above SMA confluence exposes 0.5834 and 0.5892 levels.
The New Zealand Dollar extended its rally, registering solid gains versus the US Dollar after the latest US inflation report, which tempered speculation of a Fed rate hike and trimmed investors' bets by half. At the time of writing, the NZD/USD is trading at 0.5809, up by more than 1%.
NZD/USD Price Forecast: Technical outlook
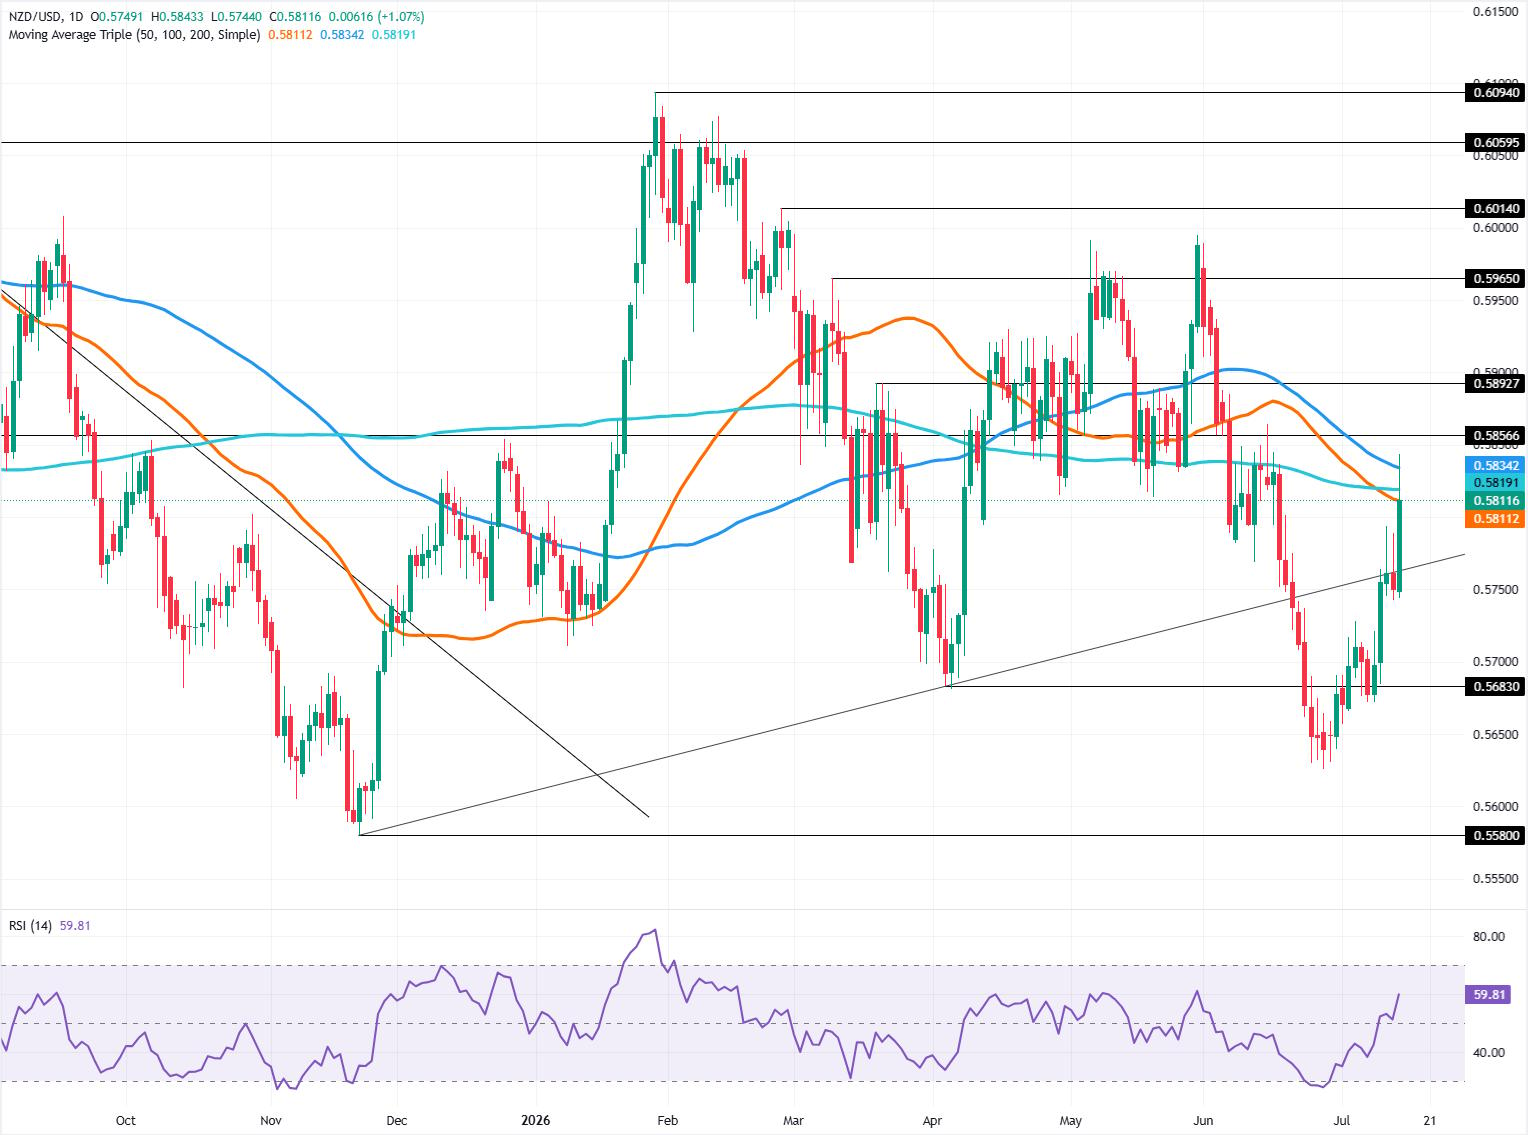
The NZD/USD trend is downwards, with the pair still trading below the 50- and 200-day Simple Moving Averages (SMAs) at around 0.5810-0.5819. Earlier, the pair reached a daily high of 0.5843, threatening to decisively clear the 200-day SMA, but sellers stepped in, driving spot prices towards the 0.5800 figure.
From a momentum standpoint, buyers are gaining traction. The Relative Strength Index (RSI) turned bullish on July 9, but the price action consolidated around 0.5750 for three days before the next leg up to 0.5800.
If the NZD/USD clears the confluence of the 50- and 200-day SMAs, this opens the path to challenge the 100-day SMA at 0.5834. A breach of the latter will expose the March 19 daily high at 0.5892, ahead of 0.5900. On further strength, the next area of interest would be the February 26 high at 0.6014.
In a bearish scenario, the NZD/USD must clear the low of the day (LOD) at 0.5744, which could exacerbate a drop towards the 0.5700 level. Below this, the next area of demand is the July 8 daily low at 0.5672.
NZD/USD Price Chart — Daily
New Zealand Dollar Price This week
The table below shows the percentage change of New Zealand Dollar (NZD) against listed major currencies this week. New Zealand Dollar was the strongest against the Japanese Yen.
| USD | EUR | GBP | JPY | CAD | AUD | NZD | CHF | |
|---|---|---|---|---|---|---|---|---|
| USD | -0.16% | -0.04% | 0.28% | -0.68% | -0.40% | -0.85% | 0.19% | |
| EUR | 0.16% | 0.12% | 0.44% | -0.54% | -0.30% | -0.70% | 0.36% | |
| GBP | 0.04% | -0.12% | 0.30% | -0.62% | -0.38% | -0.81% | 0.29% | |
| JPY | -0.28% | -0.44% | -0.30% | -1.04% | -0.68% | -1.17% | -0.12% | |
| CAD | 0.68% | 0.54% | 0.62% | 1.04% | 0.38% | -0.13% | 0.94% | |
| AUD | 0.40% | 0.30% | 0.38% | 0.68% | -0.38% | -0.41% | 0.55% | |
| NZD | 0.85% | 0.70% | 0.81% | 1.17% | 0.13% | 0.41% | 1.11% | |
| CHF | -0.19% | -0.36% | -0.29% | 0.12% | -0.94% | -0.55% | -1.11% |
The heat map shows percentage changes of major currencies against each other. The base currency is picked from the left column, while the quote currency is picked from the top row. For example, if you pick the New Zealand Dollar from the left column and move along the horizontal line to the US Dollar, the percentage change displayed in the box will represent NZD (base)/USD (quote).
Recommended Articles


