USD/CAD Price Analysis: Strengthens after Descending Triangle breakout

Source Fxstreet
  • USD/CAD rises to 1.3730 amid firm speculation that the BoC will start lowering interest rates from June.
  • The US Dollar declines despite uncertainty ahead of the US core PCE Inflation data.
  • USD/CAD holds the Descending Triangle breakout.

The USD/CAD pair extends its upside to 1.3730 in Thursday’s London session. The Loonie asset strengthens as investors expect that Bank of Canada (BoC) will start reducing interest rates from the June meeting. Sheer strength in the Loonie asset is driven by firm speculation of a prolonged policy divergence between the Federal Reserve (Fed) and the BoC.

The Loonie asset holds intraday gains even though the US Dollar slumps, suggesting that the Canadian Dollar is significantly weak. The US Dollar Index (DXY), which tracks the Greenback’s value against six major currencies, corrects to 105.00 after posting a fresh two-week high near 105.20.

The near-term outlook of the US Dollar is still upbeat amid uncertainty ahead of the United States core Personal Consumption Expenditure Price Index (PCE) data for April, which will significantly influence speculation for Fed rate cuts in September and is scheduled to be published on Friday. Annual and monthly core PCE inflation readings are estimated to have grown steadily by 2.8% and 0.3% respectively.

Currently, investors expect that the Fed will start reducing interest rates from the last quarter of the year.

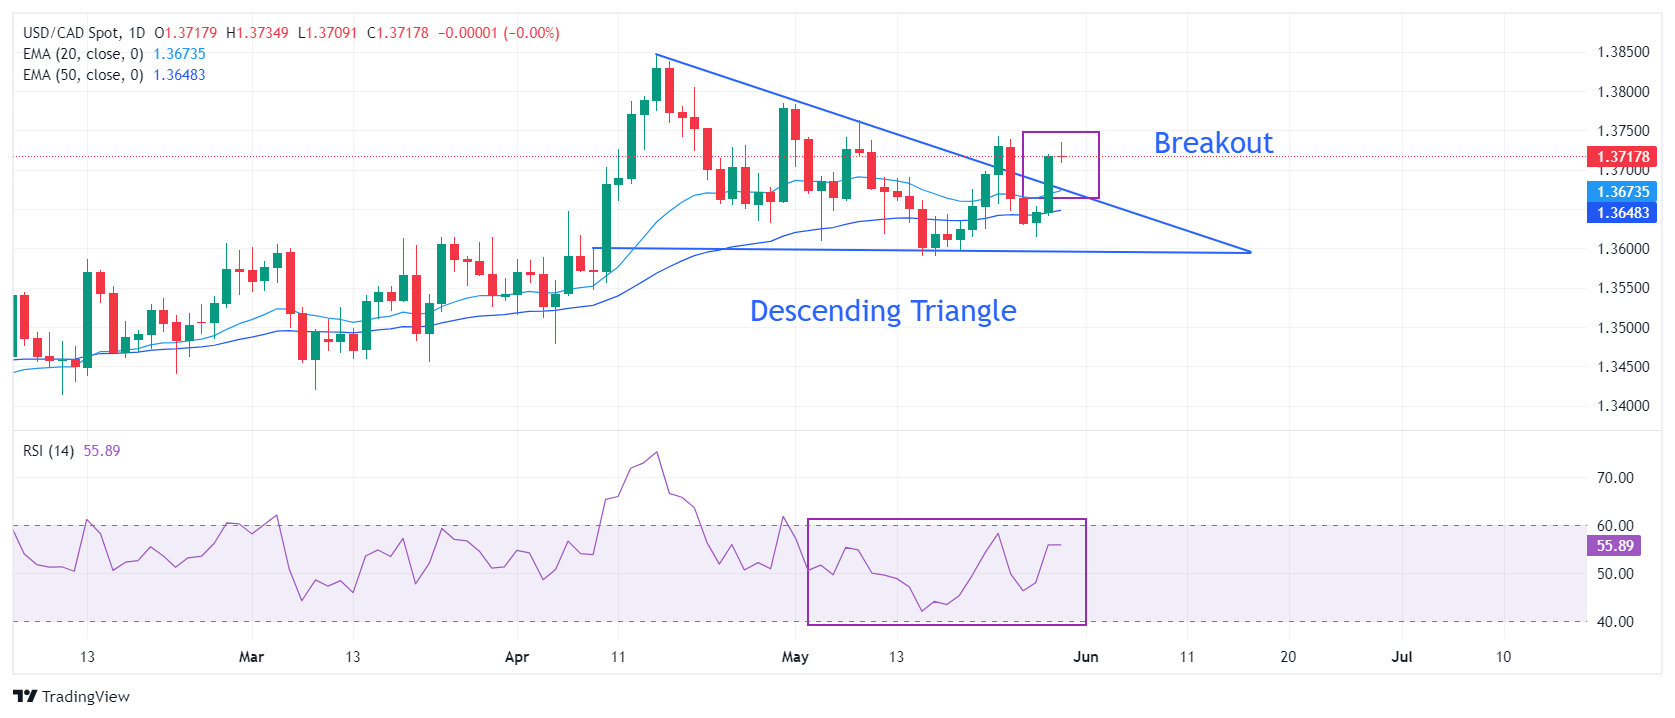
USD/CAD strengthens after a breakout of the Descending Triangle chart formation on a daily timeframe. A breakout of the above-mentioned chart pattern results in heavy volume and wider ticks on the upside.

Upward-sloping 20-and 50-day Exponential Moving Average (EMA), which trade around 1.3675 and 1.3650, respectively, suggest that the near-term trend is bullish.

The 14-period Relative Strength Index (RSI) oscillates in the 40.00-60.00 range, indicating indecisiveness among market participants.

Fresh buying opportunity would emerge if the asset breaks above April 30 high at 1.3785. This would drive the asset towards April 17 high at 1.3838, followed by the round-level resistance of 1.3900.

In an alternate scenario, a breakdown below May 3 low around 1.3600 will expose the asset to the April 9 low around 1.3547 and the psychological support of 1.3500.

USD/CAD daily chart

USD/CAD

Overview
Today last price 1.3716
Today Daily Change -0.0002
Today Daily Change % -0.01
Today daily open 1.3718
 
Trends
Daily SMA20 1.3667
Daily SMA50 1.3657
Daily SMA100 1.3575
Daily SMA200 1.3574
 
Levels
Previous Daily High 1.372
Previous Daily Low 1.3641
Previous Weekly High 1.3744
Previous Weekly Low 1.3596
Previous Monthly High 1.3846
Previous Monthly Low 1.3478
Daily Fibonacci 38.2% 1.369
Daily Fibonacci 61.8% 1.3671
Daily Pivot Point S1 1.3666
Daily Pivot Point S2 1.3615
Daily Pivot Point S3 1.3588
Daily Pivot Point R1 1.3745
Daily Pivot Point R2 1.3771
Daily Pivot Point R3 1.3823


Disclaimer: For information purposes only. Past performance is not indicative of future results.
placeholder
Top 3 Price Prediction: Bitcoin, Ethereum, Ripple – BTC, ETH and XRP Look for a Foothold After a Sharp ShakeoutBitcoin trades near $92,600 after a dip below $90,000, while Ethereum around $3,118 and XRP near $2.21–$2.23 sit on key support zones, as BTC, ETH and XRP all try to turn a sharp correction into a tradable rebound rather than a deeper slide.
Author  Mitrade
Nov 19, Wed
Bitcoin trades near $92,600 after a dip below $90,000, while Ethereum around $3,118 and XRP near $2.21–$2.23 sit on key support zones, as BTC, ETH and XRP all try to turn a sharp correction into a tradable rebound rather than a deeper slide.
placeholder
Even As Bitcoin's Price Falls, Michael Saylor Feels 'Indestructible'The price of Bitcoin dipped below $89,000, setting a new weekly low as corporate buyer Strategy remains bullish.
Author  Mitrade
Yesterday 03: 08
The price of Bitcoin dipped below $89,000, setting a new weekly low as corporate buyer Strategy remains bullish.
placeholder
Could XRP Really Catch Ethereum? Analysts Revisit the Question as ETF Tailwinds BuildAs US spot XRP ETFs roll out and issuers like Canary Capital and Franklin Templeton step in, analysts say XRP’s market cap could climb on growing utility and ETF accumulation—but overtaking Ethereum’s $373 billion smart-contract powerhouse remains a long-shot, at least for now.
Author  Mitrade
Yesterday 03: 28
As US spot XRP ETFs roll out and issuers like Canary Capital and Franklin Templeton step in, analysts say XRP’s market cap could climb on growing utility and ETF accumulation—but overtaking Ethereum’s $373 billion smart-contract powerhouse remains a long-shot, at least for now.
placeholder
Bitcoin's Drop to $86K Approaches 'Max Pain' Zone, Yet Presents Potential Buying OpportunityAnalysts identify the $84,000 to $73,000 range as Bitcoin's likely "max pain" territory where capitulation may occur.
Author  Mitrade
11 hours ago
Analysts identify the $84,000 to $73,000 range as Bitcoin's likely "max pain" territory where capitulation may occur.
placeholder
Market Meltdown: BTC, ETH, and XRP Capitulate as Bears Seize ControlBitcoin trades around $85,900 after breaking below $86,000, with Ethereum under $2,791 and XRP below $1.99 as BTC, ETH and XRP extend weekly losses of 8–10%, forcing traders to focus on supports at $85,000, $2,749 and $1.77 for clues on whether this sell-off has further to run.
Author  Mitrade
10 hours ago
Bitcoin trades around $85,900 after breaking below $86,000, with Ethereum under $2,791 and XRP below $1.99 as BTC, ETH and XRP extend weekly losses of 8–10%, forcing traders to focus on supports at $85,000, $2,749 and $1.77 for clues on whether this sell-off has further to run.
goTop
quote