


EUR/USD Forecast: Euro turns bearish, tests key support
- EUR/USD holds steady near 1.0800 following Wednesday's sharp decline.
- A daily close below 1.0790 could attract technical sellers.
- US Bureau of Economic Analysis will release the second estimate of Q1 GDP.
EUR/USD came under heavy bearish pressure in the American session on Wednesday and closed the day deep in negative territory as safe-haven flows dominated the action in financial markets. After dipping to its lowest level in two weeks below 1.0800 in the Asian session on Thursday, the pair recovered back above 1.0800.
Euro PRICE This week
The table below shows the percentage change of Euro (EUR) against listed major currencies this week. Euro was the weakest against the Swiss Franc.
| USD | EUR | GBP | JPY | CAD | AUD | NZD | CHF | |
|---|---|---|---|---|---|---|---|---|
| USD | 0.37% | 0.30% | 0.00% | 0.41% | 0.32% | 0.25% | -0.49% | |
| EUR | -0.37% | -0.10% | -0.32% | 0.04% | -0.12% | -0.22% | -0.83% | |
| GBP | -0.30% | 0.10% | -0.28% | 0.12% | -0.00% | -0.05% | -0.76% | |
| JPY | 0.00% | 0.32% | 0.28% | 0.35% | 0.28% | 0.32% | -0.54% | |
| CAD | -0.41% | -0.04% | -0.12% | -0.35% | -0.10% | -0.16% | -0.96% | |
| AUD | -0.32% | 0.12% | 0.00% | -0.28% | 0.10% | -0.02% | -0.75% | |
| NZD | -0.25% | 0.22% | 0.05% | -0.32% | 0.16% | 0.02% | -0.75% | |
| CHF | 0.49% | 0.83% | 0.76% | 0.54% | 0.96% | 0.75% | 0.75% |
The heat map shows percentage changes of major currencies against each other. The base currency is picked from the left column, while the quote currency is picked from the top row. For example, if you pick the Euro from the left column and move along the horizontal line to the US Dollar, the percentage change displayed in the box will represent EUR (base)/USD (quote).
Following Tuesday's decline, Wall Street's main indexes opened lower on Wednesday and continued to push lower. The Dow Jones Industrial Average lost over 1% on the day and the S&P 500 fell 0.75%. The US Dollar (USD) capitalized on risk aversion, with the USD Index reaching its highest level since May 14 above 105.00.
Early Thursday, US stock index futures are down between 0.5% and 0.8%, suggesting that markets could remain risk-averse in the second half of the day.
The US Bureau of Economic Analysis (BEA) will release its second estimate of the Gross Domestic Product (GDP) for the first quarter. In the initial estimate, the BEA announced that the US' GDP expanded at an annual rate of 1.6%. Markets expect a downward revision to 1.3% in the second estimate. In case there is a bigger downward revision, the USD could struggle to find demand, even if US stocks stay in the red. On the other hand, a better-than-forecast print could support the USD and weigh on EUR/USD.
The US economic docket will also feature weekly Initial Jobless Claims data. A reading near 200K could provide a boost to the USD, while an unexpected increase toward 230K could hurt the USD.
EUR/USD Technical Analysis
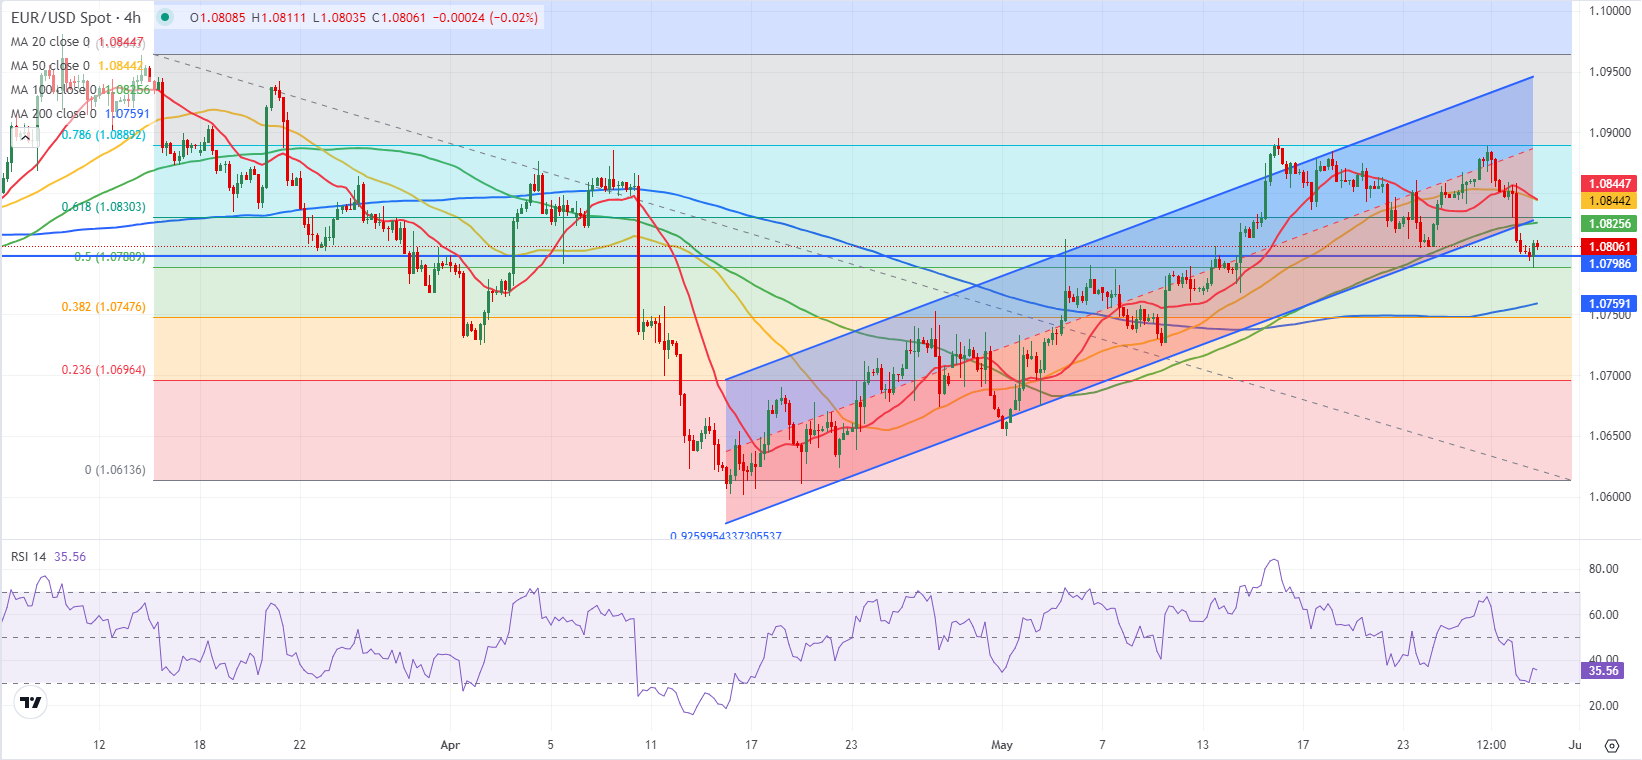
EUR/USD dropped below the lower limit of the ascending regression channel and the Relative Strength Index (RSI) indicator on the 4-hour chart fell below 40, highlighting a bearish tilt in the near term.
The 200-day Simple Moving Average (SMA) aligns as key support at 1.0790. In case the pair makes a daily close below that level and starts using it as resistance, technical sellers could remain interested. In this scenario, 1.0760-1.0750 (200-period SMA on the 4-hour chart, Fibonacci 38.2% retracement of the latest downtrend) could be seen as next support before 1.0700 (psychological level, Fibonacci 23.6% retracement).
Risk sentiment FAQs
In the world of financial jargon the two widely used terms “risk-on” and “risk off'' refer to the level of risk that investors are willing to stomach during the period referenced. In a “risk-on” market, investors are optimistic about the future and more willing to buy risky assets. In a “risk-off” market investors start to ‘play it safe’ because they are worried about the future, and therefore buy less risky assets that are more certain of bringing a return, even if it is relatively modest.
Typically, during periods of “risk-on”, stock markets will rise, most commodities – except Gold – will also gain in value, since they benefit from a positive growth outlook. The currencies of nations that are heavy commodity exporters strengthen because of increased demand, and Cryptocurrencies rise. In a “risk-off” market, Bonds go up – especially major government Bonds – Gold shines, and safe-haven currencies such as the Japanese Yen, Swiss Franc and US Dollar all benefit.
The Australian Dollar (AUD), the Canadian Dollar (CAD), the New Zealand Dollar (NZD) and minor FX like the Ruble (RUB) and the South African Rand (ZAR), all tend to rise in markets that are “risk-on”. This is because the economies of these currencies are heavily reliant on commodity exports for growth, and commodities tend to rise in price during risk-on periods. This is because investors foresee greater demand for raw materials in the future due to heightened economic activity.
The major currencies that tend to rise during periods of “risk-off” are the US Dollar (USD), the Japanese Yen (JPY) and the Swiss Franc (CHF). The US Dollar, because it is the world’s reserve currency, and because in times of crisis investors buy US government debt, which is seen as safe because the largest economy in the world is unlikely to default. The Yen, from increased demand for Japanese government bonds, because a high proportion are held by domestic investors who are unlikely to dump them – even in a crisis. The Swiss Franc, because strict Swiss banking laws offer investors enhanced capital protection.
Recommended Articles


