

EURUSD tumbles back to 1.08 region, investors turn to US GDP and PCE inflation
- EUR/USD backslid into 1.0800 on Wednesday as risk appetite withers.
- German inflation figures mixed in May, vexing ECB rate cut hopes.
- US GDP growth, PCE inflation data key print this week.
EUR/USD pulled back sharply on Wednesday, falling back to the 1.0800 handle after broad risk appetite evaporated. The pair is trading firmly into technical resistance as investors gear up for a batch of mid-tier European economic indicators on Thursday, followed by an update to US quarterly Gross Domestic Product (GDP) growth.
Forex Today: Fed rate cut bets dominate the scene
Pan-European Consumer Confidence in May is expected to hold steady at -14.3, while the overall Economic Sentiment Indicator is expected to recover slightly to 96.2 from 95.6. After that, US quarterly GDP is expected later in the day, with Annualized Q1 GDP forecast to ease slightly to 1.3% from 1.6%. Markets hungry for rate cuts from the Federal Reserve (Fed) will be looking for signs of softening in the US economy as firm growth, a tight labor market, and still-high inflation figures hamper the Fed’s ability to deliver rate cuts at a pace that investors continue to look for.
At current cut, the CME’s FedWatch Tool is pricing in slightly-better-than-even odds that the Fed will be holding rates steady in September, but hopeful traders are continuing to look for reasons to step up rate cut bets.
The trading week will close off with German Retail Sales on Friday, which are expected to contract -0.1% MoM in May. Pan-European Core Harmonized Index of Consumer Prices (HICP) for the year ended in May is forecast to tick upwards to 2.8% from 2.7%. US inflation data will close out the trading week, with US Core Personal Consumption Expenditures (PCE) Price Index inflation expected to hold flat at 0.3% MoM in April.
EUR/USD technical outlook
EUR/USD has drifted back into the 200-day Exponential Moving Average (EMA) at 1.0802, falling sharply lower after failing to recapture the 1.0900 handle. The pair remains down in 2024, falling -2.15% from the year’s opening bids near 1.1035.
Despite being on the downside, the pair is holding on the high side in the near-term, up 1.8% from the April swing low into 1.0600.
EUR/USD daily chart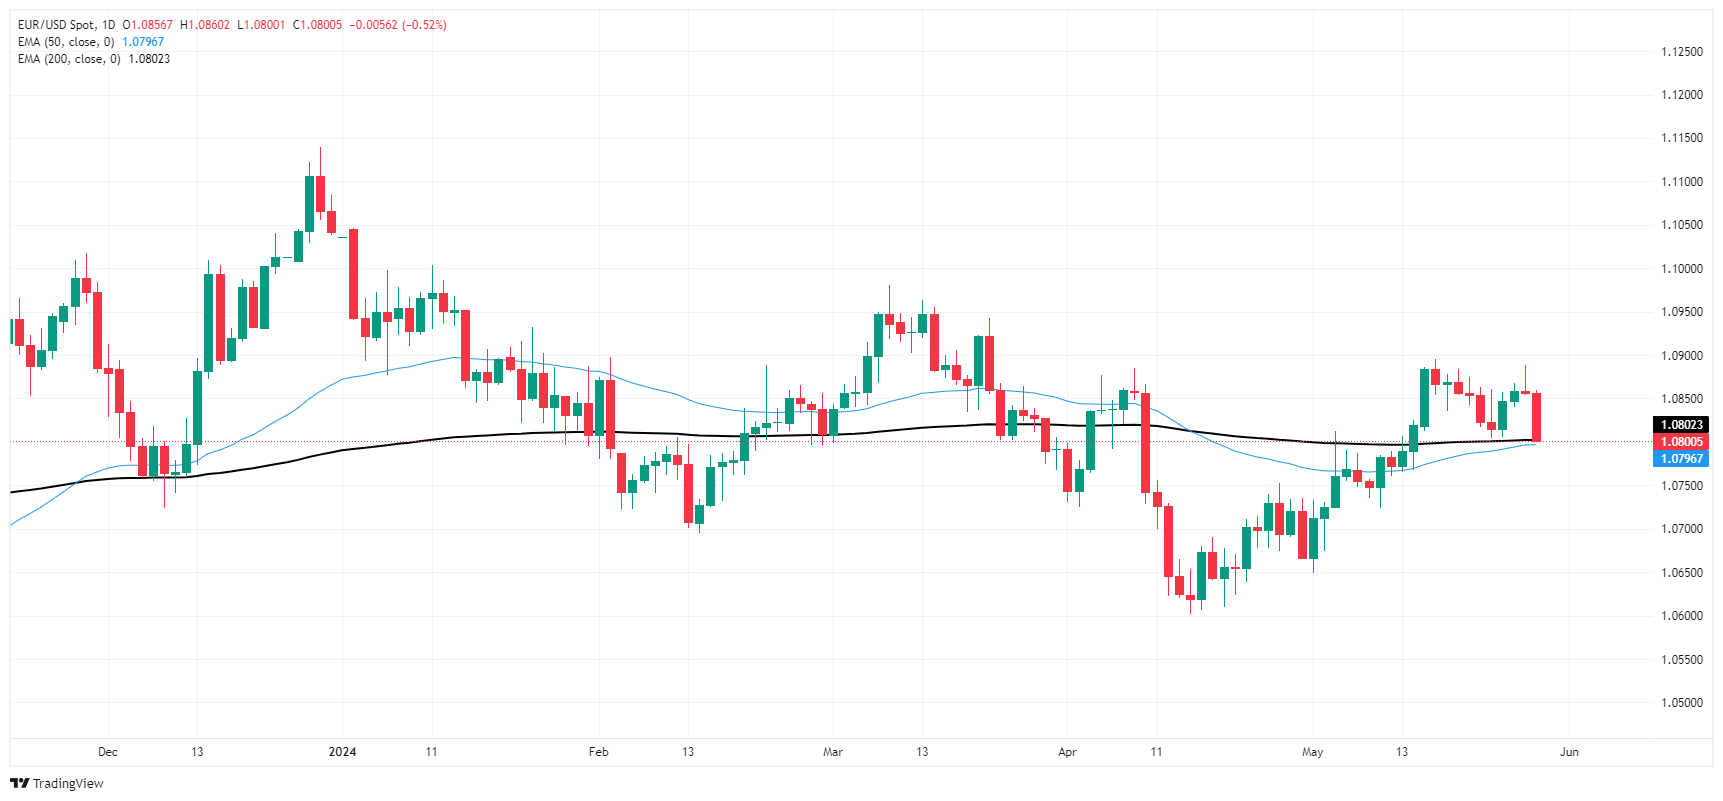
Recommended Articles


