NZD/USD Price Analysis: Forming a rectangle as it unfolds in a range

Source Fxstreet
  • NZD/USD trades in a range which could represent part of a Bull Flag continuation pattern.
  • Conditional on a break above the range highs the pair could rally up to the targets for the Bull Flag. 
  • Alternatively a break lower is possible, bringing the uptrend into doubt. 

NZD/USD has spent the last week or so forming a range bound consolidation (shaded rectangle on chart) which could represent the flag square of a Bull Flag continuation pattern. 

The pair is probably in an uptrend on a short-term basis, favoring more upside in line with the saying “the trend is your friend”, however, a break above the rectangle’s highs at 0.6153 would give more confirmation of an extension higher. 

NZD/USD 4-hour Chart 
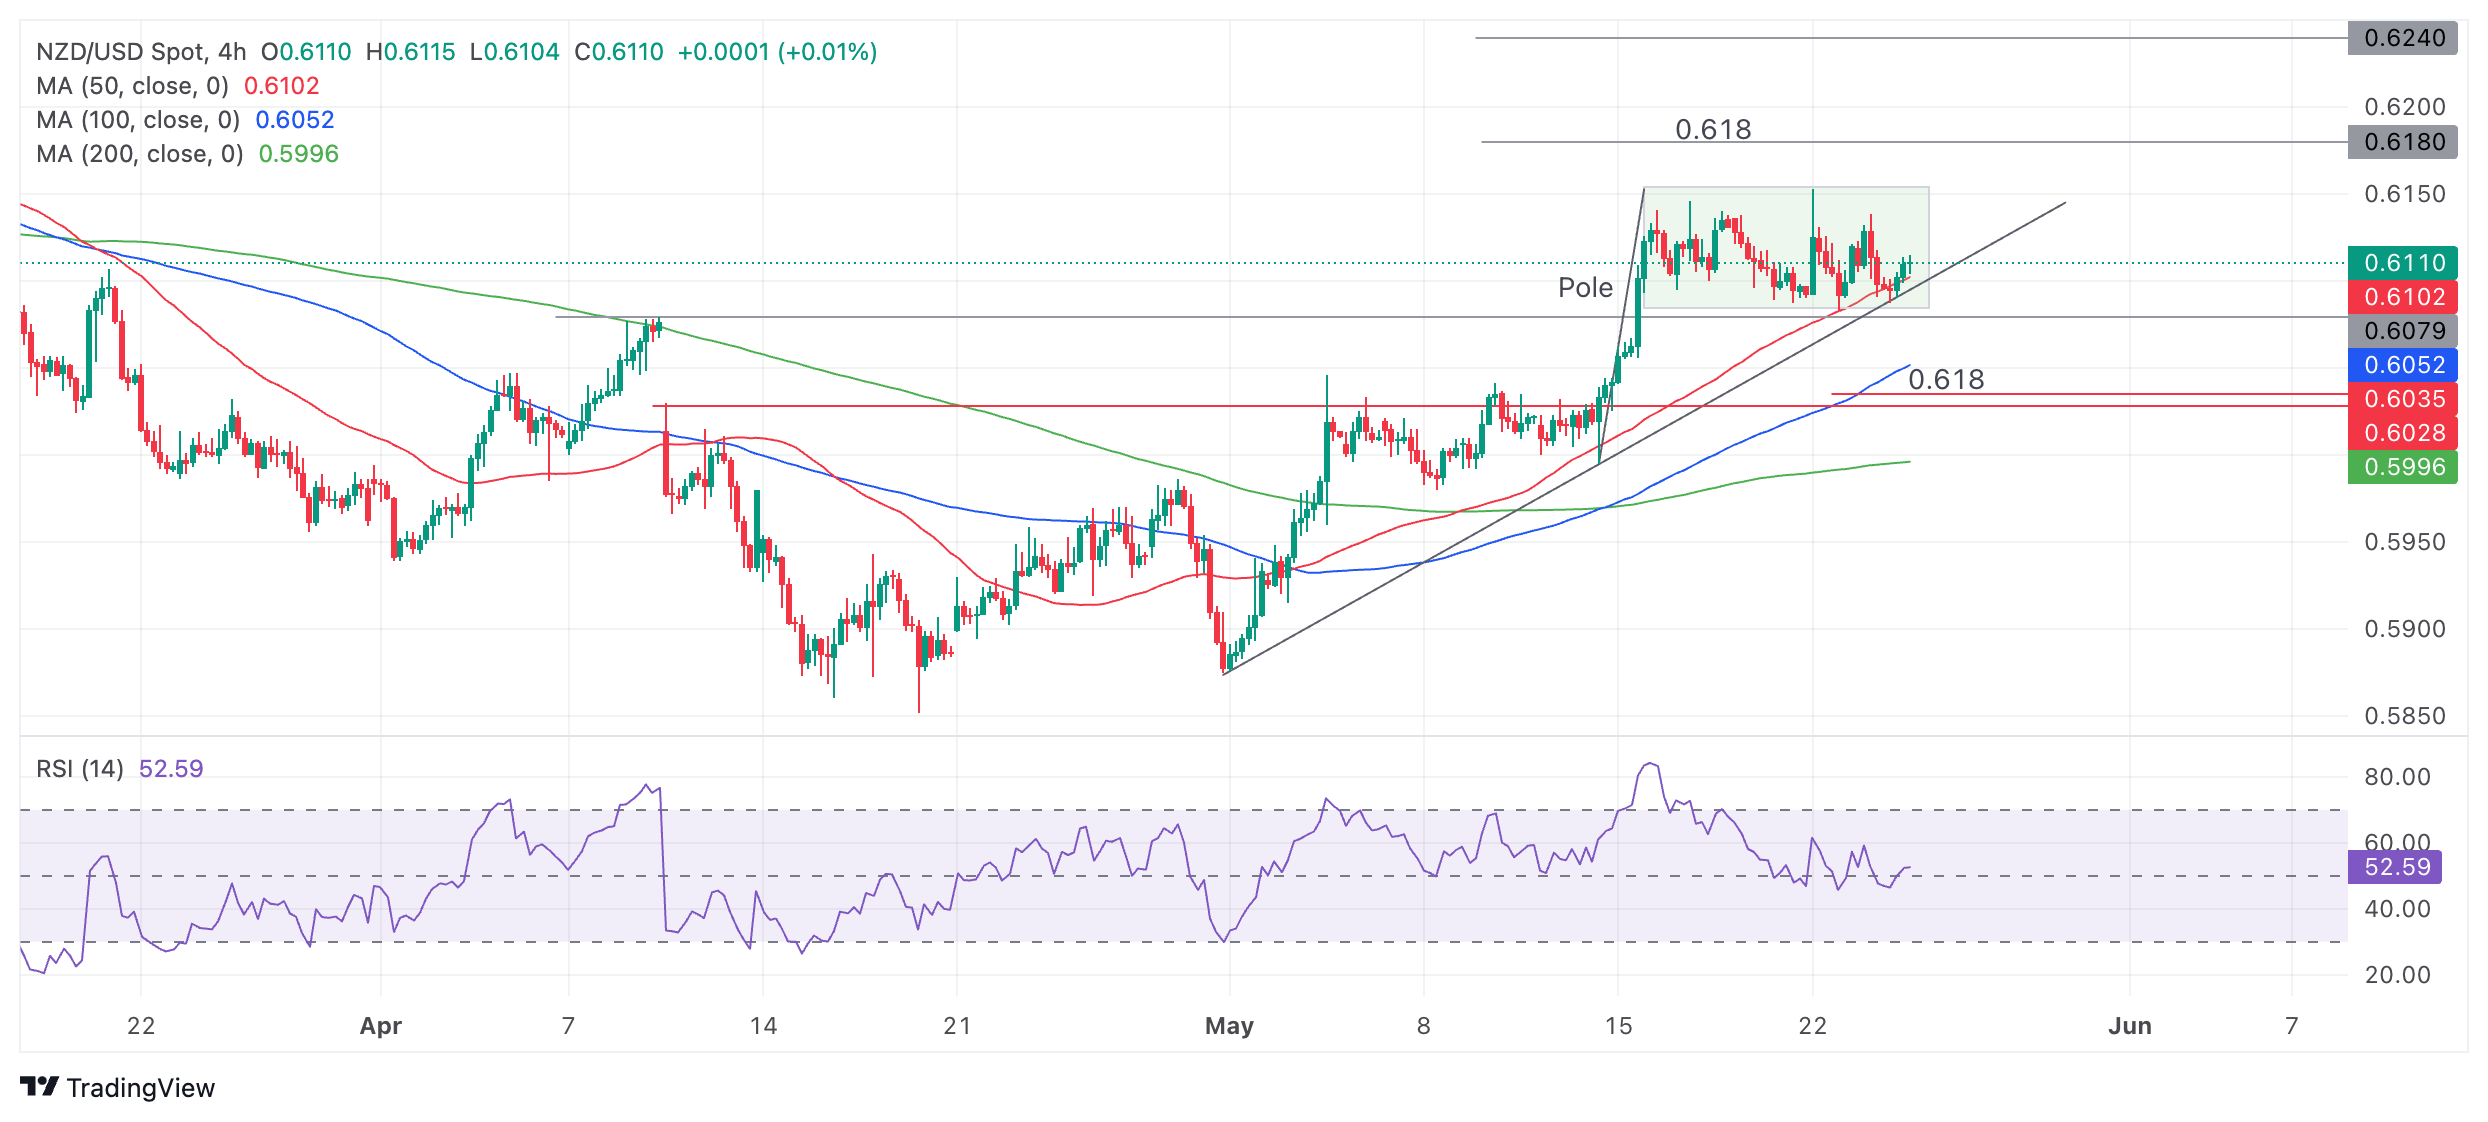
Such a breakout would probably see the price rally up to 0.6180, the first target for the Bull Flag pattern. This is calculated by taking the length of the “pole” and extrapolating it by a 0.618 Fibonacci ratio from the base of the rectangle higher. This is the conservative target for the pattern but a more bullish move could even reach the 0.6240 target at the 100% extension of the pole higher. 

A breakdown is also possible, however, and a break on a closing basis below the rectangle’s base would negate the Bull Flag hypothesis and suggest a more bearish tone to the chart. Such a break would also pierce the trendline for the move up during May and likely see NZD/USD decline to a downside target at 0.6035, the 0.618 Fib. ratio of the height of the rectangle extrapolated lower.  

Disclaimer: For information purposes only. Past performance is not indicative of future results.
placeholder
Bitcoin Outlook 2025As the Bitcoin market continues to mature, its 2025 outlook appears highly favourable, driven by institutional adoption and regulatory developments.
Author  TradingKey
Jan 23, Thu
As the Bitcoin market continues to mature, its 2025 outlook appears highly favourable, driven by institutional adoption and regulatory developments.
placeholder
WTI moves above $64.50 due to odds of Saudi Arabia raising August Oil prices for AsiaWest Texas Intermediate (WTI) Oil price gains ground for the second successive session, trading around $64.60 during the European hours on Tuesday.
Author  FXStreet
Jul 01, Tue
West Texas Intermediate (WTI) Oil price gains ground for the second successive session, trading around $64.60 during the European hours on Tuesday.
placeholder
Dogecoin Closes June In The Red With 14% Losses, Will July Be Any Better?With the close of June, the Dogecoin price has once again confirmed the bearish trend of the month.
Author  Bitcoinist
Jul 02, Wed
With the close of June, the Dogecoin price has once again confirmed the bearish trend of the month.
placeholder
Solana (SOL) Cools After Recovery — Resistance Proving Difficult to CrackSOL price is now correcting gains and might struggle to rise above the $155 resistance.
Author  NewsBTC
Jul 04, Fri
SOL price is now correcting gains and might struggle to rise above the $155 resistance.
placeholder
Silver Price Forecast: XAG/USD consolidates right below $37.00 in risk-off marketsSilver consolidates the previous two days' gains and remains pinned near $37.00.
Author  FXStreet
Jul 04, Fri
Silver consolidates the previous two days' gains and remains pinned near $37.00.
Related Instrument
goTop
quote