USD/JPY Price Analysis: Closes in on resistance with possibility of temporary pullback

Source Fxstreet
  • USD/JPY closes in on a resistance level at former highs. 
  • The pair could pullback temporarily from the technical resistance level. 
  • The uptrend remains intact, however, suggesting further upside will probably eventually follow. 


USD/JPY has rallied up to retest technical resistance at around 156.79 (May 14 high), and there is a possibility it could temporarily falter. 

USD/JPY Daily Chart

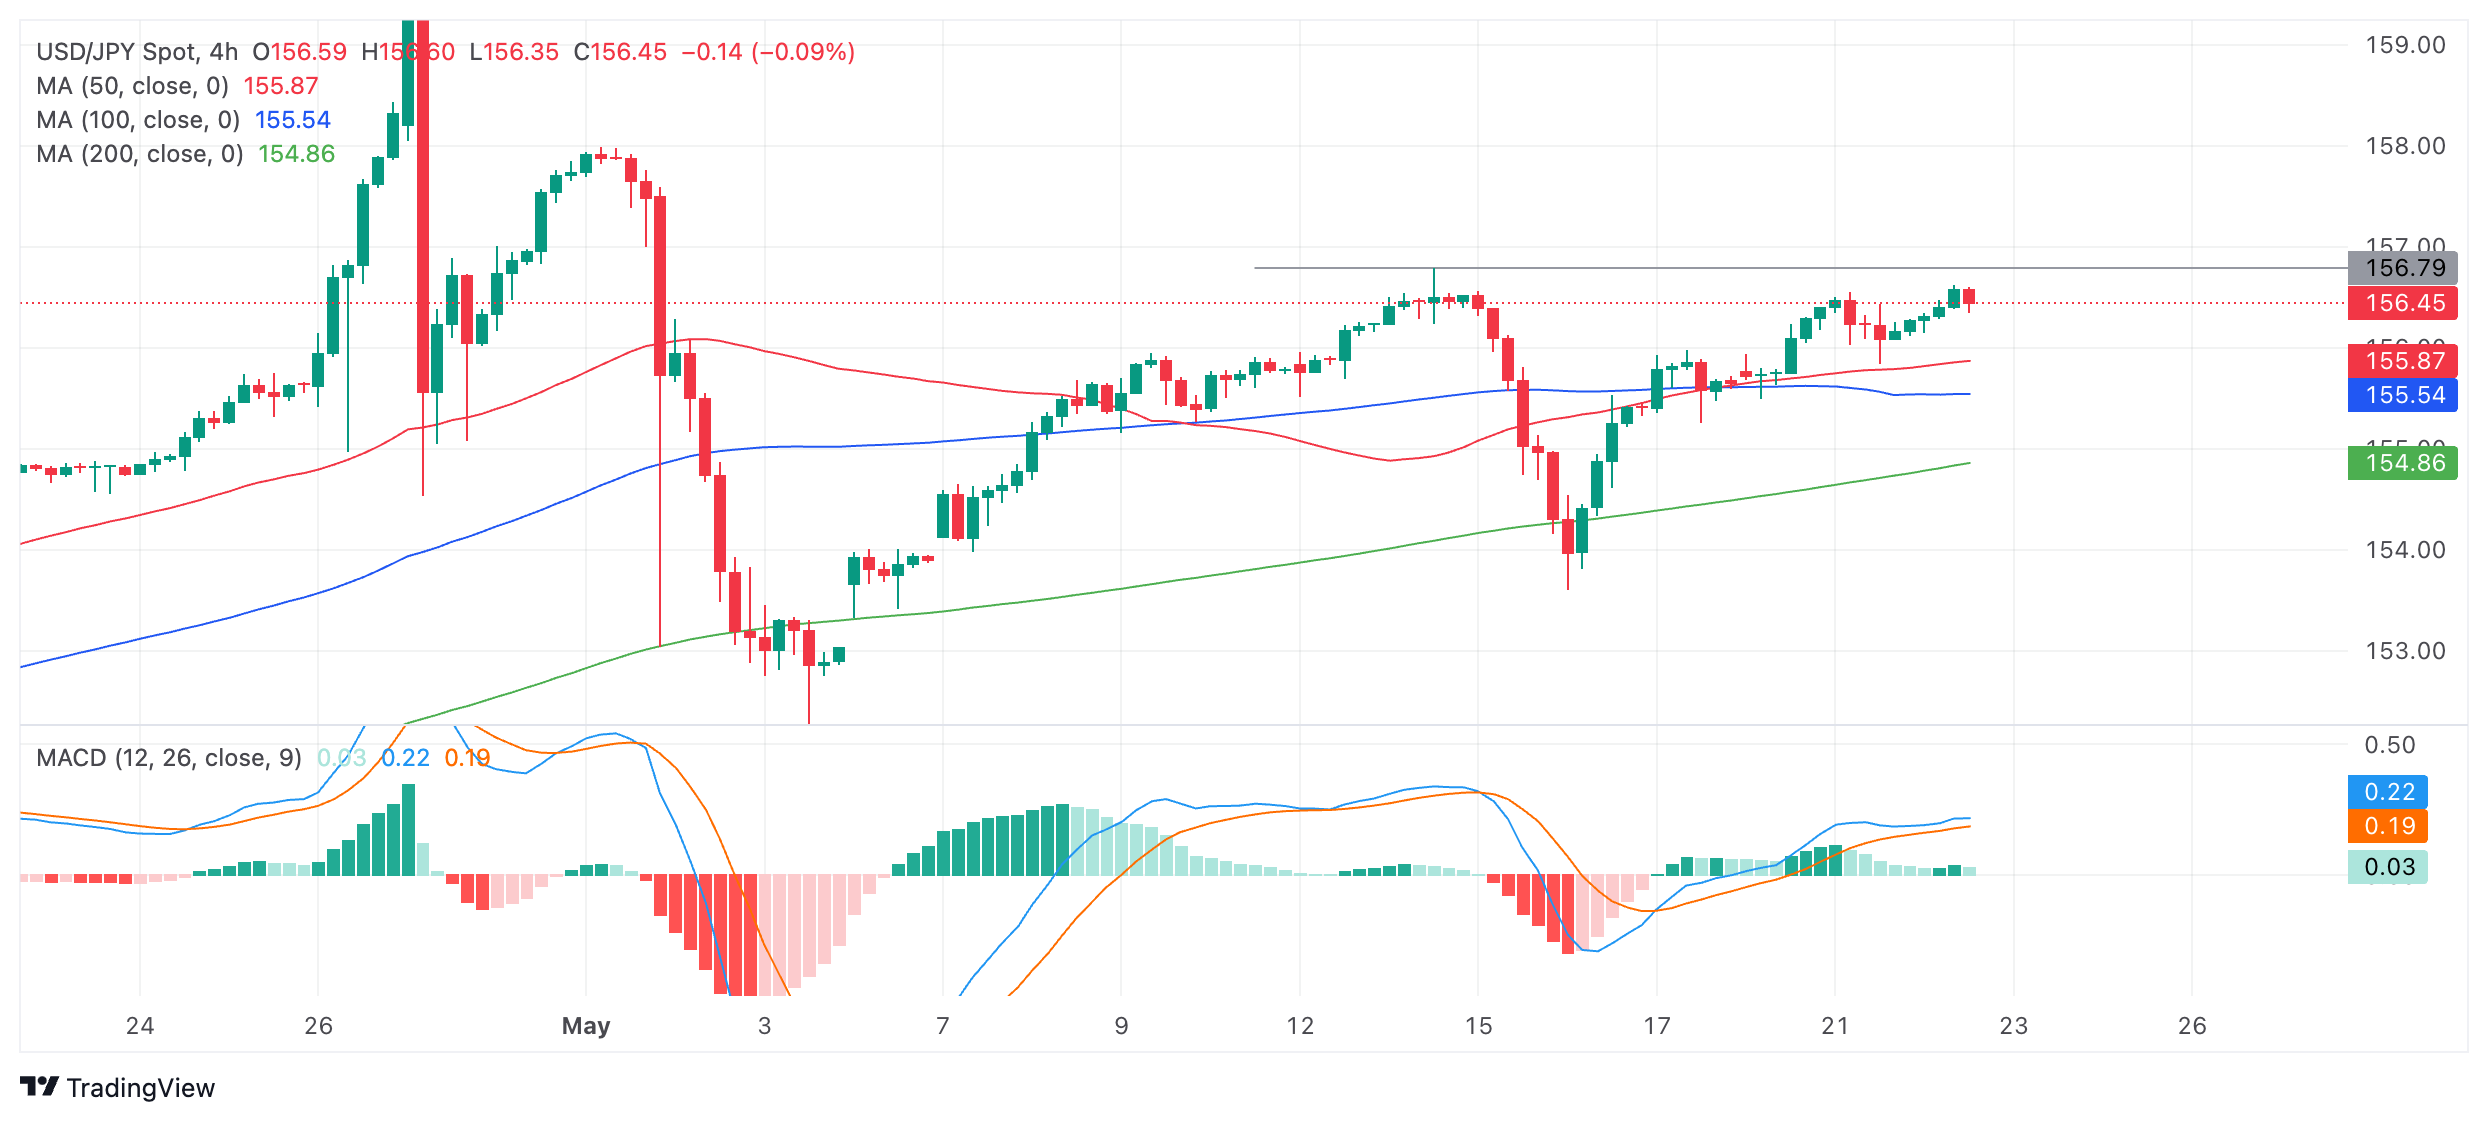
USD/JPY is in an uptrend on all timeframes, however, and given “the trend is your friend” this favors more upside eventually even if there is a correction at the aforementioned resistance level. 

The Moving Average Convergence Divergence (MACD) momentum indicator is showing a lack of momentum in the most recent move up from the May 16 lows, which could be a warning sign. The blue MACD line has not crossed below the red signal line, however, as would be expected to accompany the beginning of a deeper pullback. 

If USD/JPY corrects it will probably find support at the level of the cluster of Moving Averages between 155.50-80. 

A break above the resistance level at 156.79 on a 4-hour period closing basis would indicate a continuation of the uptrend, with the next upside target probably at the 157.98 May 1 high.

Disclaimer: For information purposes only. Past performance is not indicative of future results.
placeholder
Why a Quiet 2025 Signals a Massive 2026 Crypto Bull Run: Bitwise CIO ExplainsBitwise's Matt Hougan Predicts a Crypto Boom in 2026 Amid Current Market Struggles
Author  Mitrade
Nov 13, Thu
Bitwise's Matt Hougan Predicts a Crypto Boom in 2026 Amid Current Market Struggles
placeholder
Bitcoin vs. Ethereum: Distinct Monetary UniversesBitcoin and Ethereum are diverging significantly in their monetary roles, according to a joint report from Glassnode and Keyrock.
Author  Mitrade
Yesterday 03: 01
Bitcoin and Ethereum are diverging significantly in their monetary roles, according to a joint report from Glassnode and Keyrock.
placeholder
Ethereum slides 5% as bears lean on $3,500 cap and put $3,150 support in focusEthereum (ETH) drops more than 5% after a failed push above $3,550, with price sliding to $3,153 and now holding below $3,350, the 100-hour SMA and a bearish trend line at $3,500; unless bulls reclaim the $3,350–$3,500 zone, the short-term bias stays bearish and a clean break under $3,150 could expose $3,050, $3,000 and even the $2,880–$2,850 support area.
Author  Mitrade
Yesterday 03: 41
Ethereum (ETH) drops more than 5% after a failed push above $3,550, with price sliding to $3,153 and now holding below $3,350, the 100-hour SMA and a bearish trend line at $3,500; unless bulls reclaim the $3,350–$3,500 zone, the short-term bias stays bearish and a clean break under $3,150 could expose $3,050, $3,000 and even the $2,880–$2,850 support area.
placeholder
Gold Posts Biggest Weekly Gain in a Month as US Data Delays Fuel UncertaintyGold climbed higher on Friday, marking its strongest weekly performance in a month, as traders weighed the impact of a data backlog following the end of the US government's extended shutdown. Silver also moved upward.
Author  Mitrade
Yesterday 05: 48
Gold climbed higher on Friday, marking its strongest weekly performance in a month, as traders weighed the impact of a data backlog following the end of the US government's extended shutdown. Silver also moved upward.
placeholder
Top 3 Price Prediction: Bitcoin, Ethereum, Ripple – BTC, ETH, and XRP flash deeper downside risks as market selloff intensifiesBitcoin (BTC), Ethereum (ETH) and Ripple (XRP) trade in red on Friday after correcting more than 5%, 10% and 2%, respectively, so far this week.
Author  FXStreet
22 hours ago
Bitcoin (BTC), Ethereum (ETH) and Ripple (XRP) trade in red on Friday after correcting more than 5%, 10% and 2%, respectively, so far this week.
Related Instrument
goTop
quote