USD/JPY Price Analysis: Sideways below 156.50 as US yields fall

Source Fxstreet
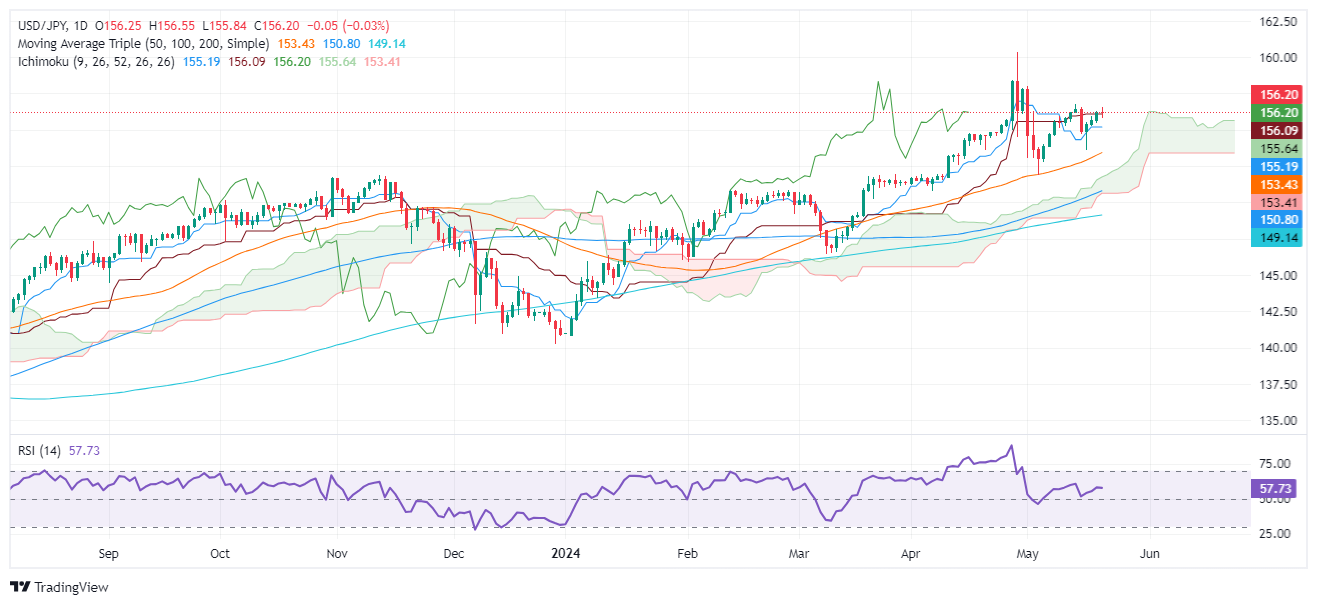
  • USD/JPY faces resistance at 156.50 as 10-year Treasury yields decline.
  • Bullish technical outlook with waning momentum; RSI under 50 could signal potential losses.
  • Resistance levels lie at 156.76, 157.00, and YTD high of 160.32.
  • Key support emerges at 156.00, Senkou Span A (155.61), and Kijun-Sen (155.18).

The USD/JPY pair faces stir resistance at around 156.50 retreats as the US 10-year Treasury note yield drops three and a half basis points, a headwind for the Greenback. The positive correlation between the major and the US 10-year note yield weighed on the pair, down 0.06%, and trades at 156.19.

USD/JPY Price Analysis: Technical outlook

The USD/JPY remains upward biased, but buyers seem to have lost some momentum. They remain unable to bring the pair upwards and challenge the latest cycle high of 156.76, the May 14 high. The Relative Strength Index (RSI) suggests that buying pressure is fading. Despite standing in bullish territory, if the RSI punches below the 50-midline, that could pave the way for USD/JPY losses.

For a bullish continuation, the USD/JPY first resistance would be 156.76, followed by 157.00. Up next would be the May 1 high at 157.98, ahead of challenging the year-to-date (YTD) high of 160.32.

On the flip side, and the most likely path in the near term, if USD/JPY tumbles below 156.00, the first support would be the Senkou Span A at 155.61. Once cleared, the next stop would be the Kijun-Sen at 155.18 ahead of 155.00.

USD/JPY Price Action – Daily Chart

USD/JPY

Overview
Today last price 156.21
Today Daily Change -0.04
Today Daily Change % -0.03
Today daily open 156.25
 
Trends
Daily SMA20 155.49
Daily SMA50 153.26
Daily SMA100 150.66
Daily SMA200 149.08
 
Levels
Previous Daily High 156.31
Previous Daily Low 155.5
Previous Weekly High 156.79
Previous Weekly Low 153.6
Previous Monthly High 160.32
Previous Monthly Low 150.81
Daily Fibonacci 38.2% 156
Daily Fibonacci 61.8% 155.81
Daily Pivot Point S1 155.73
Daily Pivot Point S2 155.21
Daily Pivot Point S3 154.92
Daily Pivot Point R1 156.54
Daily Pivot Point R2 156.83
Daily Pivot Point R3 157.35


Disclaimer: For information purposes only. Past performance is not indicative of future results.
placeholder
Crypto Market Outlook: Bitcoin, Ethereum, and XRP Tumble as BoJ Hawkishness Sparks Risk-Off RoutBitcoin slides below $87,000, Ethereum leans on $2,800 support and XRP hovers around $2.00 as December opens with a risk-off tone, leaving BTC eyeing $80,600–$74,508, ETH exposed to $2,111 and XRP to $1.90 unless buyers can turn key levels into a base for a rebound.
Author  Mitrade
Dec 01, Mon
Bitcoin slides below $87,000, Ethereum leans on $2,800 support and XRP hovers around $2.00 as December opens with a risk-off tone, leaving BTC eyeing $80,600–$74,508, ETH exposed to $2,111 and XRP to $1.90 unless buyers can turn key levels into a base for a rebound.
placeholder
Solana Price Forecast: ETF Demand and Derivatives Flows Fuel a Sharper ReboundSolana (SOL) trades above $140 after a 10% daily jump, as ETF inflows flip positive, futures open interest climbs 6.75% and on-chain TVL and stablecoin liquidity rise, setting up a potential double-bottom breakout toward the 50-day EMA at $158 if SOL can secure a daily close above $145.
Author  Mitrade
Dec 03, Wed
Solana (SOL) trades above $140 after a 10% daily jump, as ETF inflows flip positive, futures open interest climbs 6.75% and on-chain TVL and stablecoin liquidity rise, setting up a potential double-bottom breakout toward the 50-day EMA at $158 if SOL can secure a daily close above $145.
placeholder
AUD/USD holds steady above 0.6600; remains close to two-month high ahead of US PCE dataThe AUD/USD pair enters a bullish consolidation phase during the Asian session on Friday and oscillates in a range around the 0.6600 round figure, just below a nearly two-month high, touched the previous day.
Author  FXStreet
Yesterday 01: 36
The AUD/USD pair enters a bullish consolidation phase during the Asian session on Friday and oscillates in a range around the 0.6600 round figure, just below a nearly two-month high, touched the previous day.
placeholder
Gold Price Forecast: XAU/USD flat lines near $4,200 ahead of US PCE inflation releaseGold price (XAU/USD) trades on a flat note near $4,205 during the early Asian trading hours on Friday. Rising US Treasury yields and upbeat US jobs data cap upside for the precious metal. Traders might prefer to wait on the sidelines ahead of the key US inflation data.
Author  FXStreet
23 hours ago
Gold price (XAU/USD) trades on a flat note near $4,205 during the early Asian trading hours on Friday. Rising US Treasury yields and upbeat US jobs data cap upside for the precious metal. Traders might prefer to wait on the sidelines ahead of the key US inflation data.
placeholder
Bitcoin Pauses for Breath Above $92,000 as Bulls Weigh Next Run at $95,000Bitcoin consolidates above $92,000 and the 100-hour SMA as traders eye a breakout toward $96,450 or a potential retracement to $90,500 support.
Author  Mitrade
23 hours ago
Bitcoin consolidates above $92,000 and the 100-hour SMA as traders eye a breakout toward $96,450 or a potential retracement to $90,500 support.
goTop
quote