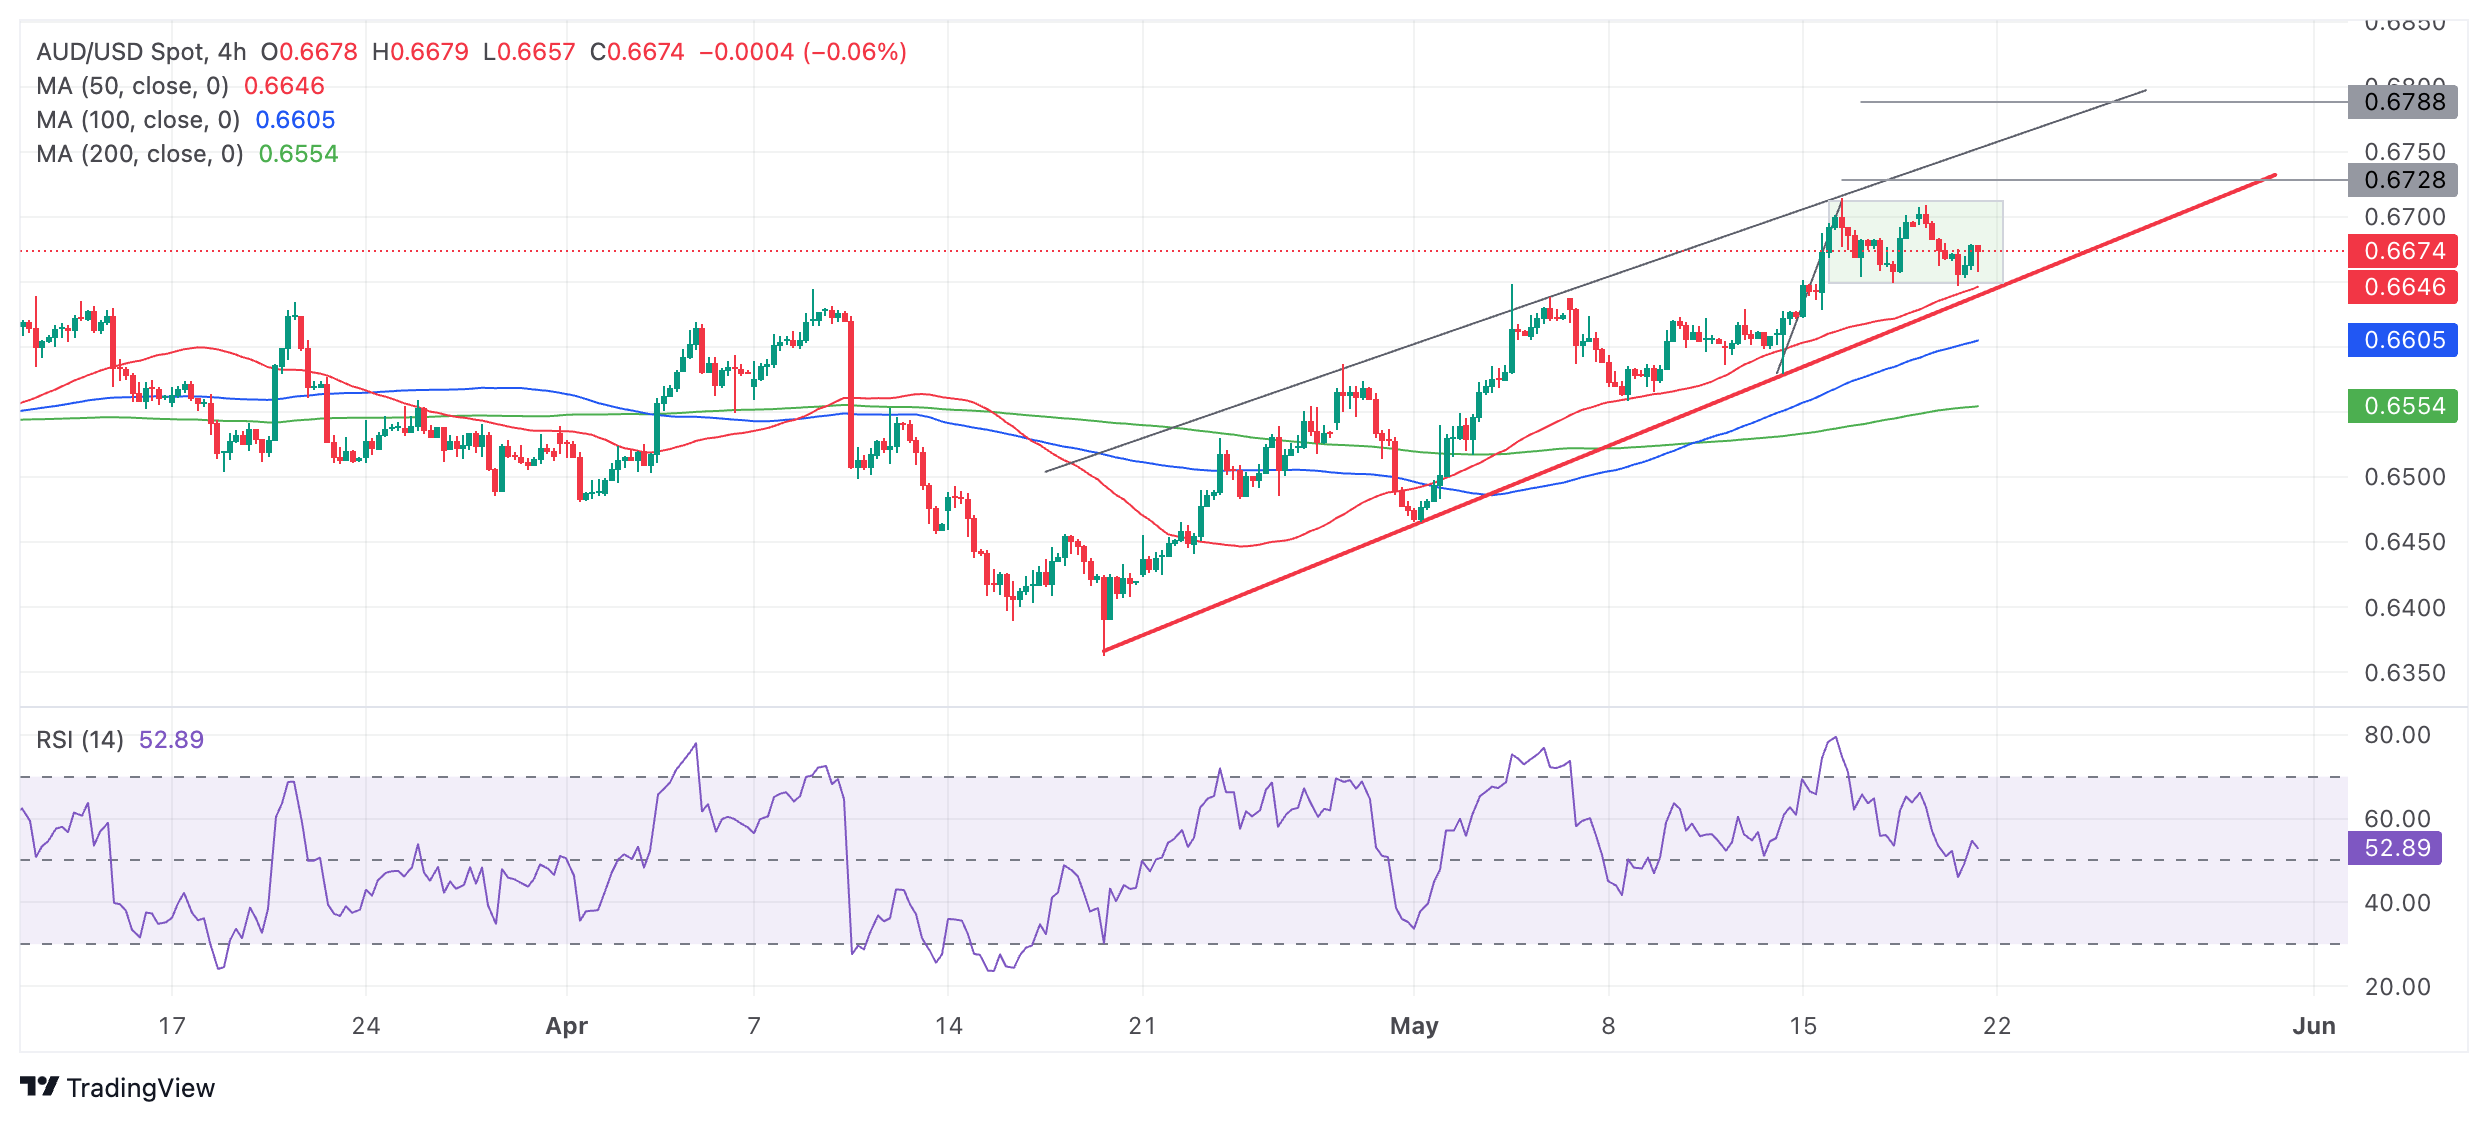
AUD/USD Price Analysis: Bull Flag continuation pattern possibly forming

Source Fxstreet
  • AUD/USD might be forming a bullish continuation pattern on the four-hour chart.
  • A break above the 0.6714 high could confirm a continuation of the short-term uptrend. 
  • A break below the red trendline would bring into question the dominant uptrend. 

AUD/USD is rising in a channel in a short-term uptrend that is biased to extend, given the old adage that “the trend is your friend”. 

The Aussie is potentially forming a Bull Flag continuation pattern on the four-hour chart. 

A break above the top of the consolidation that represents the “flag square” (shaded rectangle on chart below) and the 0.6714 May 16 highs, would confirm activation of the Bull Flag and a continuation of the short-term uptrend up to an initial target at 0.6728. Further bullishness could even see price rise to 0.6788. 

AUD/USD 4-hour Chart

The Aussie is in a short-term uptrend indicated by the rising peaks and troughs on the four-hour chart since the April 19 lows. 

A decisive break below the red trendline would be a bearish sign which could denote a change of the short-term trend.

Decisive would be characterized as a break that was accompanied by a long red candle that closed near its low or three red candles in a row that broke through the trendline.


Disclaimer: For information purposes only. Past performance is not indicative of future results.
placeholder
Nearly $2 Billion Wiped Out in Crypto Liquidations Amid Brutal Sell-OffThe crypto market experienced nearly $2 billion in liquidations over the past 24 hours, as the total market capitalization dropped below $3 trillion for the first time in five months.Bitcoin (BTC) alo
Author  Beincrypto
11 hours ago
The crypto market experienced nearly $2 billion in liquidations over the past 24 hours, as the total market capitalization dropped below $3 trillion for the first time in five months.Bitcoin (BTC) alo
placeholder
Market Meltdown: BTC, ETH, and XRP Capitulate as Bears Seize ControlBitcoin trades around $85,900 after breaking below $86,000, with Ethereum under $2,791 and XRP below $1.99 as BTC, ETH and XRP extend weekly losses of 8–10%, forcing traders to focus on supports at $85,000, $2,749 and $1.77 for clues on whether this sell-off has further to run.
Author  Mitrade
17 hours ago
Bitcoin trades around $85,900 after breaking below $86,000, with Ethereum under $2,791 and XRP below $1.99 as BTC, ETH and XRP extend weekly losses of 8–10%, forcing traders to focus on supports at $85,000, $2,749 and $1.77 for clues on whether this sell-off has further to run.
placeholder
Bitcoin's Drop to $86K Approaches 'Max Pain' Zone, Yet Presents Potential Buying OpportunityAnalysts identify the $84,000 to $73,000 range as Bitcoin's likely "max pain" territory where capitulation may occur.
Author  Mitrade
17 hours ago
Analysts identify the $84,000 to $73,000 range as Bitcoin's likely "max pain" territory where capitulation may occur.
placeholder
Whale Dump Meets Quantum Panic: Bitcoin Slips to $86,000 and Blows $220 Million LongsBitcoin fell below $87,000 on November 20, 2025, amid a storm of quantum security fears and $1.3 billion whale capitulation. In the process, it blew almost $220 million in long positions out of the wa
Author  Beincrypto
18 hours ago
Bitcoin fell below $87,000 on November 20, 2025, amid a storm of quantum security fears and $1.3 billion whale capitulation. In the process, it blew almost $220 million in long positions out of the wa
placeholder
EUR/USD dives further as traders pare back Fed cuts betsEUR/USD extends losses for the fifth consecutive day and trades at 1.1520 at the time of writing on Thursday after a sharp reversal from levels near 1.1600 on Wednesday.
Author  FXStreet
Yesterday 10: 42
EUR/USD extends losses for the fifth consecutive day and trades at 1.1520 at the time of writing on Thursday after a sharp reversal from levels near 1.1600 on Wednesday.
goTop
quote