EUR/JPY Price Analysis: Bearish sentiment takes over, 20-day SMA lost

Source Fxstreet
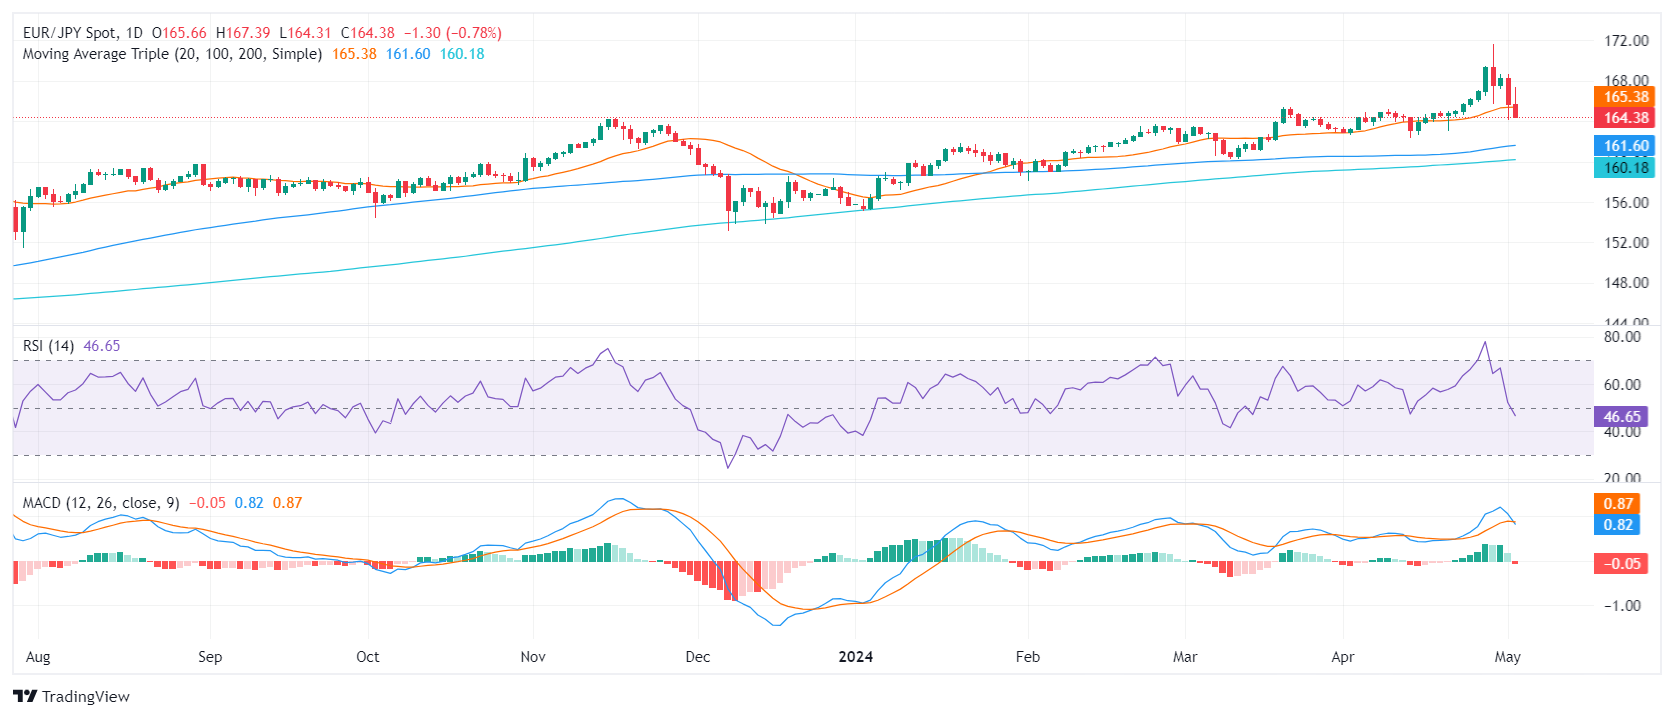
  • The daily RSI for EUR/JPY highlights a decline from overbought levels to negative territory, depicting seller dominance.
  • Similar to the RSI, the daily MACD shows increasing negative momentum.
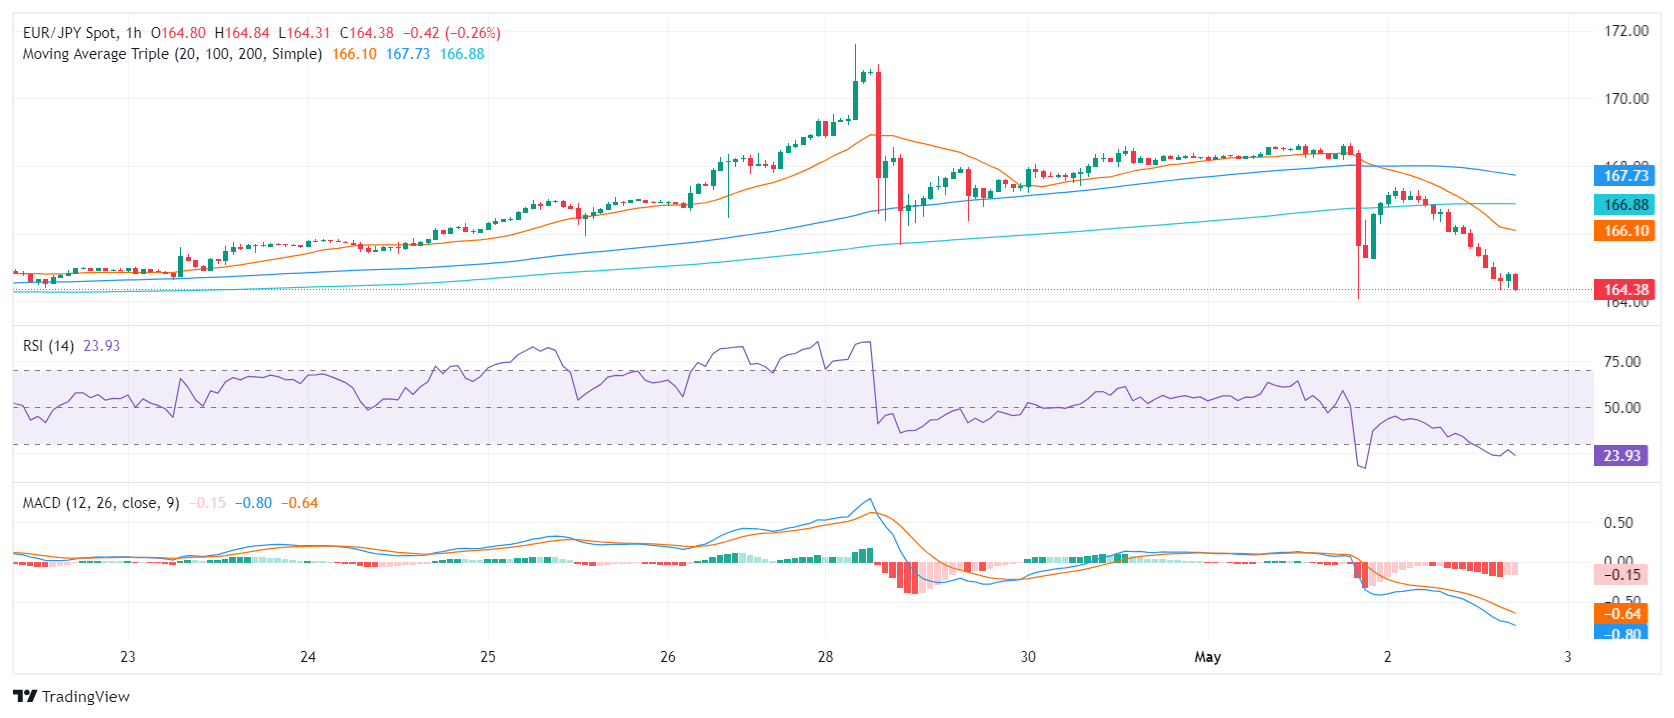
  • On the hourly chart, low RSI values and a flat red MACD histogram point to a growing near-term bearishness.

The EUR/JPY pair trades at 164.65,  tallying sharp losses on Thursday. Despite the increasing selling pressure, the long-term optimism remains intact, but bears are making their case as they reclaimed the 20-day Simple Moving Average (SMA) which worsened the outlook for the short term.

On the daily chart, the Relative Strength Index (RSI) for EUR/JPY has descended from the overbought readings into negative territory. The data suggests a downward momentum, indicative of a current dominant presence of sellers. At the same time, the Moving Average Convergence Divergence (MACD) histogram recorded fresh red bars which confirms a growing negative momentum.

EUR/JPY daily chart

Moving to the hourly chart, the RSI values are persistently recording low readings, venturing deep into the oversold territory. Here, the hourly MACD aligns with the daily outlook, displaying red bars which points to further negative momentum over the shorter span.

EUR/JPY hourly chart

From a broader viewpoint, the EUR/JPY experienced a significant shift, falling below the 20-day Simple Moving Average (SMA). This suggests potential short-term bearishness but as long as the pair maintains positions above the more extended 100 and 200-day SMAs, the overall outlook will be positive.


EUR/JPY

Overview
Today last price 164.43
Today Daily Change -1.25
Today Daily Change % -0.75
Today daily open 165.68
 
Trends
Daily SMA20 165.36
Daily SMA50 163.91
Daily SMA100 161.52
Daily SMA200 160.13
 
Levels
Previous Daily High 168.67
Previous Daily Low 164.08
Previous Weekly High 169.4
Previous Weekly Low 164.4
Previous Monthly High 171.6
Previous Monthly Low 162.28
Daily Fibonacci 38.2% 165.83
Daily Fibonacci 61.8% 166.91
Daily Pivot Point S1 163.61
Daily Pivot Point S2 161.55
Daily Pivot Point S3 159.02
Daily Pivot Point R1 168.2
Daily Pivot Point R2 170.73
Daily Pivot Point R3 172.79


Disclaimer: For information purposes only. Past performance is not indicative of future results.
placeholder
Ethereum (ETH) Price Closes Above $3,900 — Is a New All-Time High Possible Before 2024 Ends?Once again, the price of Ethereum (ETH) has risen above $3,900. This bounce has hinted at a further price increase for the altcoin before the end of the year.
Author  Beincrypto
Dec 17, 2024
Once again, the price of Ethereum (ETH) has risen above $3,900. This bounce has hinted at a further price increase for the altcoin before the end of the year.
placeholder
Analyst Flags XRP as Market’s ‘Best Risk/Reward’ Play as Token Tests Critical $1.60 SupportCrypto analyst Scott Melker identifies a prime risk/reward setup for XRP as it tests key support at $1.60, offering a tight stop-loss against potential upside targets near $2.00.
Author  Mitrade
Feb 03, Tue
Crypto analyst Scott Melker identifies a prime risk/reward setup for XRP as it tests key support at $1.60, offering a tight stop-loss against potential upside targets near $2.00.
placeholder
Ethereum Price Forecast: ETH faces heavy distribution as price slips below average cost basis of investorsEthereum (ETH) extended its decline on Wednesday, dropping more than 5% over the past 24 hours toward the $2,100 level, which is below the $2,310 average cost basis or realized price of investors, according to CryptoQuant's data.
Author  FXStreet
Feb 05, Thu
Ethereum (ETH) extended its decline on Wednesday, dropping more than 5% over the past 24 hours toward the $2,100 level, which is below the $2,310 average cost basis or realized price of investors, according to CryptoQuant's data.
placeholder
Bitcoin Leverage Flush Evaporates $775M as Capital Rotates Into Defensive Infra PlaysBitcoin's plunge to $70K triggers a $775M leverage washout, driving a capital rotation into quantum-secure infrastructure project BMIC as investors seek uncorrelated alpha.
Author  Mitrade
Feb 05, Thu
Bitcoin's plunge to $70K triggers a $775M leverage washout, driving a capital rotation into quantum-secure infrastructure project BMIC as investors seek uncorrelated alpha.
placeholder
Bitcoin Surrenders $65,000 as Analysts Warn of ‘Structural’ Market BreakBitcoin plunges 11% to break $65k as analysts term the crash "structural," citing a $1 trillion market wipeout and $2.09 billion in daily liquidations.
Author  Mitrade
Yesterday 01: 03
Bitcoin plunges 11% to break $65k as analysts term the crash "structural," citing a $1 trillion market wipeout and $2.09 billion in daily liquidations.
Related Instrument
goTop
quote