GBP/USD Price Analysis: Advances to near 1.2550 with expectations of a momentum shift

Source Fxstreet
May 2, 2024 06:17
  • GBP/USD gains ground as technical indicators suggest a momentum shift for the pair.
  • The momentum indicator could confirm a weakening of the bearish bias once it breaks above the centerline.
  • The pair could meet the immediate barrier at the upper boundary of the descending channel around 1.2570 level.

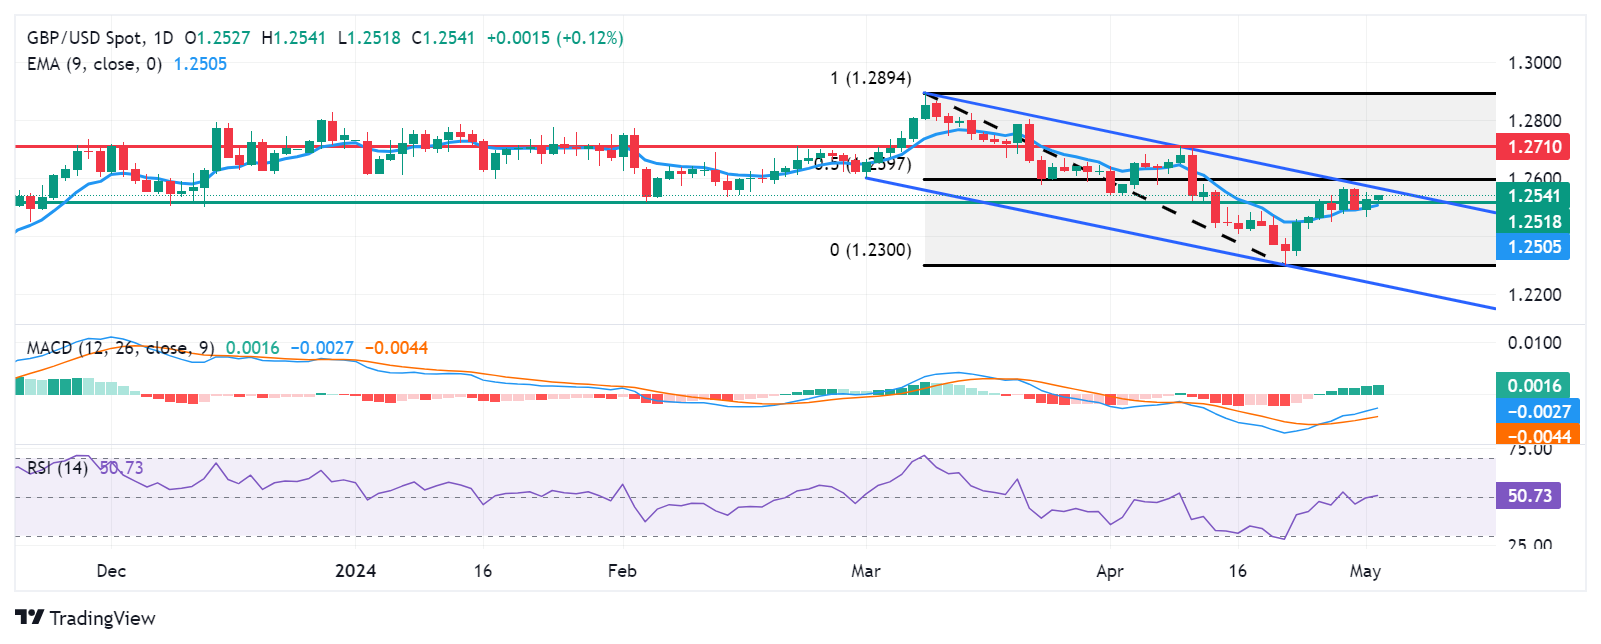
GBP/USD extends its gains for the second successive session on Thursday, trading around 1.2530 during the Asian session. The pair consolidates within the descending channel on a daily chart, with the 14-day Relative Strength Index (RSI) positioning on the 50-level. A further increase will indicate the weakening of a bearish bias.

Additionally, the Moving Average Convergence Divergence (MACD) indicates a momentum shift as it is positioned above the signal line but below the centerline. This momentum indicator could confirm the weakening of the bearish bias once it breaks above the centerline.

The GBP/USD pair could test the immediate throwback support at the 1.2518 level, followed by the nine-day Exponential Moving Average (EMA) at 1.2504 and the psychological level of 1.2500. A break below this level could exert pressure on the pair to navigate the region around the six-month low of 1.2300, followed by the lower boundary of the descending channel around the level of 1.2240.

On the upside, the immediate resistance appears at the upper boundary of the descending channel around the level of 1.2570 followed by the 50% retracement level at 1.2597 level, plotting between the range of 1.2894 and 1.2300.

A breakthrough above the latter could support the GBP/USD pair to explore the area around the pullback resistance at the 1.2710 level.

GBP/USD: Daily Chart
GBP/USD

Overview
Today last price 1.2535
Today Daily Change 0.0009
Today Daily Change % 0.07
Today daily open 1.2526
 
Trends
Daily SMA20 1.2507
Daily SMA50 1.2618
Daily SMA100 1.2648
Daily SMA200 1.2551
 
Levels
Previous Daily High 1.255
Previous Daily Low 1.2466
Previous Weekly High 1.2542
Previous Weekly Low 1.23
Previous Monthly High 1.2709
Previous Monthly Low 1.23
Daily Fibonacci 38.2% 1.2518
Daily Fibonacci 61.8% 1.2498
Daily Pivot Point S1 1.2479
Daily Pivot Point S2 1.2431
Daily Pivot Point S3 1.2395
Daily Pivot Point R1 1.2562
Daily Pivot Point R2 1.2598
Daily Pivot Point R3 1.2646


Disclaimer: For information purposes only. Past performance is not indicative of future results.
placeholder
USD/JPY Price Analysis: Climbs above 156.00 as bulls target 157.00The USD/JPY climbed during the North American session after inflation data in the United States (US) showed that prices on the producer side edged higher than expected.
Source  Fxstreet
The USD/JPY climbed during the North American session after inflation data in the United States (US) showed that prices on the producer side edged higher than expected.
placeholder
AUD/USD extends its upside to 0.6620 after US PPI report, US Inflation in focusThe AUD/USD pair rises further to 0.6620 in Tuesday’s New York session.
Source  Fxstreet
The AUD/USD pair rises further to 0.6620 in Tuesday’s New York session.
placeholder
USD/CHF extends gains to near 0.9100 ahead of US PPIUSD/CHF continues to gain ground for the third successive session, trading around 0.9090 during the Asian hours on Tuesday.
Source  Fxstreet
USD/CHF continues to gain ground for the third successive session, trading around 0.9090 during the Asian hours on Tuesday.
goTop
quote