EUR/GBP Price Analysis: Back inside the multi-month range

Source Fxstreet
  • EUR/GBP has crashed back inside its multi-month range. 
  • It is falling to the range floor where it is likely to meet strong support. 
  • A break lower would activate downside targets based on the height of the range.

EUR/GBP is trading back inside its multi-month range after forming five down days in a row. The range stretches from roughly a ceiling level at 0.8600 and a floor at 0.8530. 

EUR/GBP Daily Chart 


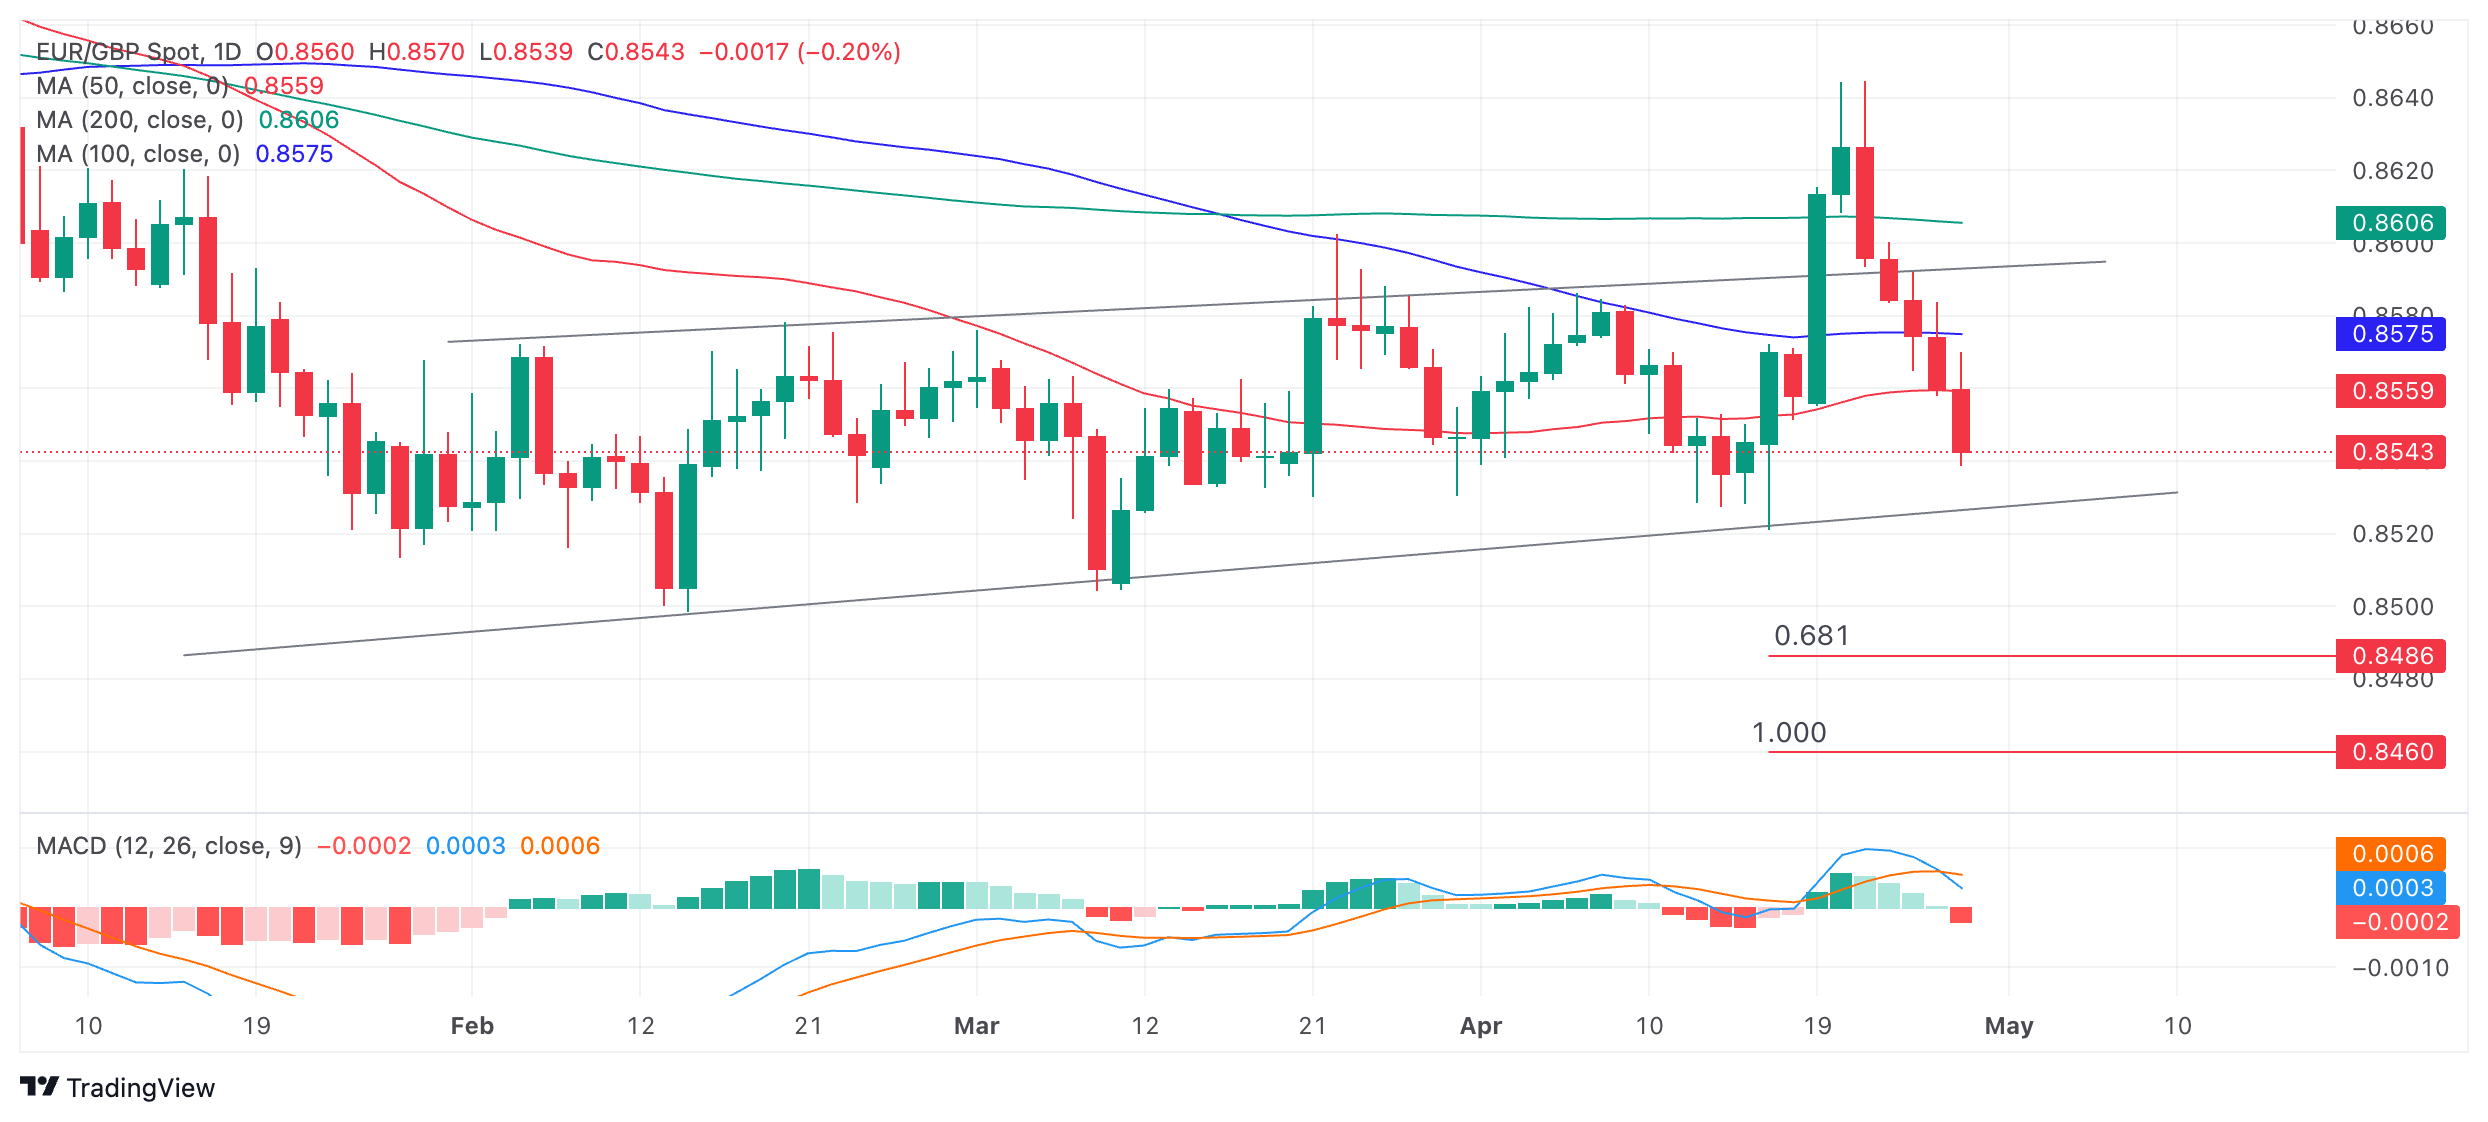
EUR/GBP has fallen to 0.8541, which is quite close to the range floor at 0.8530. At the level of the range floor it is likely to encounter relatively tough support, and will probably bounce, at the very least temporarily. 

A decisive break below the range low would open the way for more downside to the next target lower at 0.8486. This is the 0.681 Fibonacci ratio of the height of the range extrapolated down from the channel’s base, the method used by technical analysts to estimate range breakouts. Further weakness could even see price match the target at 0.8460. 

EUR/GBP broke out of the top of its multi-month consolidation range on April 19 and rose up to a peak of 0.8645 before forming a Tweezer Top candlestick reversal pattern at the highs, reversing and tumbling back down. The Tweezer Top forms when two adjacent candlesticks peak, their wicks are of similar length, and end at the same or very similar levels. 

The pair then declined rapidly, breaking back inside the range and is now on its way to the range lows. 

EUR/GBP is in a sideways trend which is forecast to continue until a directional bias proves otherwise. 

The Moving Average Convergence Divergence (MACD) indicator has just crossed below its signal line, giving a sell signal and indicating more downside. The signal is improved by the fact the pair is in a sideways trend and MACD is proven to be a more reliable indicator in non-trending markets.


Disclaimer: For information purposes only. Past performance is not indicative of future results.
placeholder
Ethereum (ETH) Price Closes Above $3,900 — Is a New All-Time High Possible Before 2024 Ends?Once again, the price of Ethereum (ETH) has risen above $3,900. This bounce has hinted at a further price increase for the altcoin before the end of the year.
Author  Beincrypto
Dec 17, 2024
Once again, the price of Ethereum (ETH) has risen above $3,900. This bounce has hinted at a further price increase for the altcoin before the end of the year.
placeholder
Analyst Flags XRP as Market’s ‘Best Risk/Reward’ Play as Token Tests Critical $1.60 SupportCrypto analyst Scott Melker identifies a prime risk/reward setup for XRP as it tests key support at $1.60, offering a tight stop-loss against potential upside targets near $2.00.
Author  Mitrade
Feb 03, Tue
Crypto analyst Scott Melker identifies a prime risk/reward setup for XRP as it tests key support at $1.60, offering a tight stop-loss against potential upside targets near $2.00.
placeholder
Ethereum Price Forecast: ETH faces heavy distribution as price slips below average cost basis of investorsEthereum (ETH) extended its decline on Wednesday, dropping more than 5% over the past 24 hours toward the $2,100 level, which is below the $2,310 average cost basis or realized price of investors, according to CryptoQuant's data.
Author  FXStreet
Feb 05, Thu
Ethereum (ETH) extended its decline on Wednesday, dropping more than 5% over the past 24 hours toward the $2,100 level, which is below the $2,310 average cost basis or realized price of investors, according to CryptoQuant's data.
placeholder
Bitcoin Drops to $70,000. U.S. Government Refuses to Bail Out Market, End of Bull Market or Golden Pit? The U.S. government refuses to bail out Bitcoin, and with Fed rate cuts nowhere in sight, a continued downward trend to test for a bottom is likely after a brief rebound.During the mid-da
Author  TradingKey
Feb 05, Thu
The U.S. government refuses to bail out Bitcoin, and with Fed rate cuts nowhere in sight, a continued downward trend to test for a bottom is likely after a brief rebound.During the mid-da
placeholder
Bitcoin Surrenders $65,000 as Analysts Warn of ‘Structural’ Market BreakBitcoin plunges 11% to break $65k as analysts term the crash "structural," citing a $1 trillion market wipeout and $2.09 billion in daily liquidations.
Author  Mitrade
Feb 06, Fri
Bitcoin plunges 11% to break $65k as analysts term the crash "structural," citing a $1 trillion market wipeout and $2.09 billion in daily liquidations.
Related Instrument
goTop
quote