EUR/USD Price Analysis: Bulls are not out of the woods, despite reclaiming 1.0700

Source Fxstreet
  • EUR/USD rises due to US GDP shortfall and elevated inflation data.
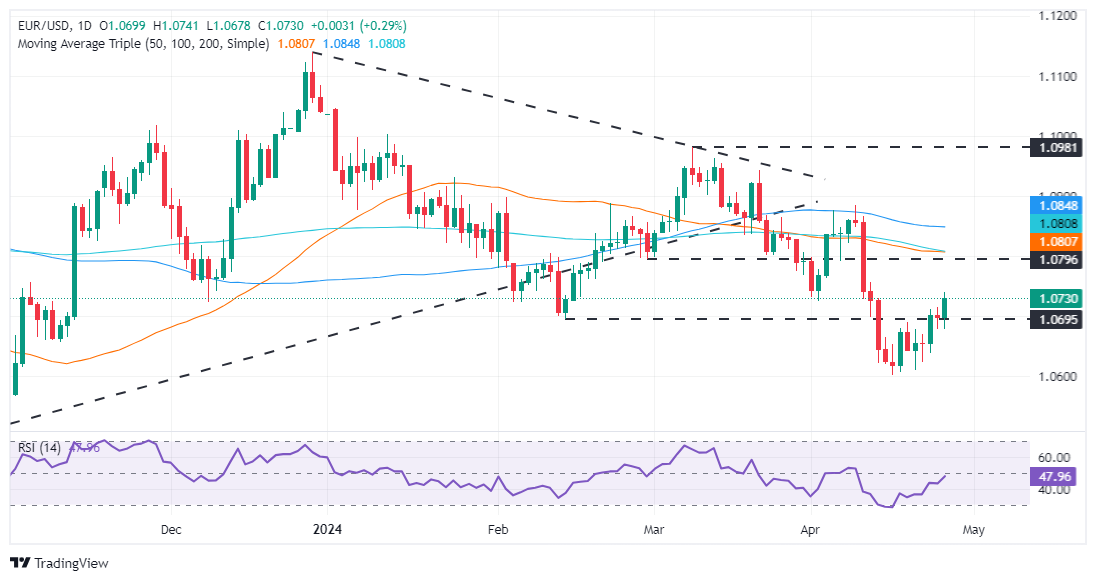
  • Technical resistance near 50 and 200-day MAs at 1.0805/07; 100-DMA at 1.0848 next hurdle.
  • Downside below 1.0694 could retest year's low at 1.0601, possibly extending to 1.0516.

On Thursday, the Euro rose against the US Dollar after US economic data portrayed the economy as weaker than expected. At the same time, the inflation figure prompted investors to price out the Federal Reserve's rate cuts in 2024. At the time of writing, the EUR/USD trades at 1.0729, up by 0.29%.

EUR/USD Price Analysis: Technical outlook

From a technical standpoint, the EUR/USD remains bearishly biased, but in the short term, it could test the confluence of the 50 and 200-day moving averages (DMAs) at 1.0805/07. If buyers clear that stir resistance, buyers must crack the 100-DMA at 1.0848. Subsequent gains are seen above that level, with the 1.0900 mark up next.

On the flip side, if EUR/USD sellers drag the spot price below the February 14 low of 1.0694, that would pave the way toward the year-to-date (YTD) low of 1.0601, followed by the November 1, 2023, intermediate support at 1.0516.

EUR/USD Price Action – Daily Chart

EUR/USD

Overview
Today last price 1.0729
Today Daily Change 0.0030
Today Daily Change % 0.28
Today daily open 1.0699
 
Trends
Daily SMA20 1.0735
Daily SMA50 1.0808
Daily SMA100 1.0849
Daily SMA200 1.081
 
Levels
Previous Daily High 1.0714
Previous Daily Low 1.0678
Previous Weekly High 1.069
Previous Weekly Low 1.0601
Previous Monthly High 1.0981
Previous Monthly Low 1.0768
Daily Fibonacci 38.2% 1.0692
Daily Fibonacci 61.8% 1.07
Daily Pivot Point S1 1.068
Daily Pivot Point S2 1.0661
Daily Pivot Point S3 1.0643
Daily Pivot Point R1 1.0716
Daily Pivot Point R2 1.0733
Daily Pivot Point R3 1.0752


Disclaimer: For information purposes only. Past performance is not indicative of future results.
placeholder
2025 Black Friday is coming! Which stocks may see volatility?Coming on the day right after Thanksgiving in the United States, Back Friday marks the start of the holiday shopping season. Sales data from this shopping frenzy day reflects investor confidence and consumer trends. The National Retail Federation (NRF) predicts that holiday season (Nov and Dec) retail sales in 2025 will likely exceed $1 trillion for the very first time, which represents a year-over-year increase of 3.7 to 4.2 percent. Historic data from the past decade show that the retail sector has generally outperformed the S&P 500 during the weeks before and after Black Friday. The following retailing companies are expected to be big winners:
Author  Insights
Nov 24, Mon
Coming on the day right after Thanksgiving in the United States, Back Friday marks the start of the holiday shopping season. Sales data from this shopping frenzy day reflects investor confidence and consumer trends. The National Retail Federation (NRF) predicts that holiday season (Nov and Dec) retail sales in 2025 will likely exceed $1 trillion for the very first time, which represents a year-over-year increase of 3.7 to 4.2 percent. Historic data from the past decade show that the retail sector has generally outperformed the S&P 500 during the weeks before and after Black Friday. The following retailing companies are expected to be big winners:
placeholder
Bitcoin Bleeds to $86K, But This Key Indicator Screams "The Top Isn't In"Bitcoin’s adjusted Spent Output Profit Ratio (aSOPR) has spent nearly two years coiling below the extremes seen at past bull-market peaks, even as BTC trades around $86,300 and down 9% on the week — a setup that leaves open the possibility that this cycle’s true top may still lie ahead.
Author  Mitrade
Nov 25, Tue
Bitcoin’s adjusted Spent Output Profit Ratio (aSOPR) has spent nearly two years coiling below the extremes seen at past bull-market peaks, even as BTC trades around $86,300 and down 9% on the week — a setup that leaves open the possibility that this cycle’s true top may still lie ahead.
placeholder
Bitcoin Price Rebound Gains Traction with $90K Break in SightBitcoin is trading above $87,000 and its 100-hour SMA after rebounding from $83,500, with a bearish trend line at $88,200 and resistance at $89,000–$90,000 now in focus as BTC either breaks higher toward $91,750–$94,000 or slips back toward $86,700, $85,000 and lower supports.
Author  Mitrade
Yesterday 02: 58
Bitcoin is trading above $87,000 and its 100-hour SMA after rebounding from $83,500, with a bearish trend line at $88,200 and resistance at $89,000–$90,000 now in focus as BTC either breaks higher toward $91,750–$94,000 or slips back toward $86,700, $85,000 and lower supports.
placeholder
Bitcoin Targets $89K Breakout as S&P 500 Nears ATH on Fed Rate Cut HopesBitcoin price action shows signs of a potential short squeeze as it hovers near $88,000, with analysts watching liquidity dynamics that could push it toward $89,000 or retrace to $85,000.
Author  Mitrade
5 hours ago
Bitcoin price action shows signs of a potential short squeeze as it hovers near $88,000, with analysts watching liquidity dynamics that could push it toward $89,000 or retrace to $85,000.
placeholder
Ethereum Reclaims $3K Handle—Is a Breakout Imminent?Ethereum has jumped back above $3,000 and reclaimed key Fib levels, with a bullish trend line at $2,880 and strong MACD/RSI readings putting a breakout above $3,120–$3,165 — and a possible run toward $3,320–$3,350 — on the table, as long as support around $2,980–$2,920 holds.
Author  Mitrade
5 hours ago
Ethereum has jumped back above $3,000 and reclaimed key Fib levels, with a bullish trend line at $2,880 and strong MACD/RSI readings putting a breakout above $3,120–$3,165 — and a possible run toward $3,320–$3,350 — on the table, as long as support around $2,980–$2,920 holds.
goTop
quote