


Mexican Peso dips as US inflation rises, trimming Fed rate cut hopes
- Mexican Peso depreciates by over 0.5% against US Dollar, reacting to unexpected inflation reacceleration in the US.
- US GDP growth for Q1 2024 falls short of forecasts at 1.6%, but a sharp increase in core PCE inflation to 3.7% boosts US yields.
- The rise in US yields and recalibrated Fed rate cut expectations drove USD/MXN to a weekly high of 17.38.
The Mexican Peso (MXN) fell during the North American session on Thursday, depreciating more than 0.5% against the US Dollar following the release of the Gross Domestic Product (GDP) in the United States (US) for the first quarter of 2024, which was weaker than expected. At the same time, the US Bureau of Economic Analysis (BEA) revealed that inflation for the same period increased sharply, spurring a jump in US Treasury yields, and weighed on the Mexican currency. At the time of writing, the USD/MXN trades at 17.18 after bouncing off a daily low of 17.01.
Thursday’s main driver for the Mexican Peso was US data. GDP for the first quarter missed estimates of 2.5% QoQ and expanded by 1.6%. By itself, that warranted US Dollar weakness, but digging deeper into the US BEA report, the core Personal Consumption Expenditure (PCE) price index for Q1 on a quarterly basis rose by 3.7%, higher than the expected 3.4% and up from 2%.
Market participants ditched the Mexican Peso as the USD/MXN rallied sharply, refreshing weekly highs at 17.38. US Treasury yields skyrocketed, while investors had priced out interest rate cuts by the US Federal Reserve (Fed) in 2024.
The data spooked investors of the emerging market currency. Speculation that the interest rate differential between Mexico and the US would likely shrink has spurred outflows from the Peso toward the Greenback.
Daily digest market movers: Mexican Peso depreciates as US inflation picks up
- Mexico’s inflation report on Wednesday capped the USD/MXN advance. Even though mid-month inflation rose by 4.63% YoY, above March’s reading and estimates of 4.48%, the Core readings slowed sharply to 4.39% YoY as projected, down from 4.69%. Despite being a mixed reading, core prices are beginning to cool down, depicting a clear downtrend in inflation.
- Citibanamex Survey showed that most analysts expect Banxico to hold rates unchanged at the May meeting. The median foresees a rate cut in June, while they estimate the main reference rate to end at 10.00%, up from 9.63% previously.
- Banxico Governor Victoria Rodriguez Ceja said that service inflation is not slowing as expected. She added that the Peso’s strength has helped to temper inflationary pressure and lower imported goods. She emphasized that Banxico would remain data-dependent.
- Mexico’s economy is faring well as Economic Activity expanded in February compared to January’s data. Figures increased by 1.4% MoM and 4.4% YoY in the second month of the year, up from January’s 0.9% and 1.9% expansion, respectively.
- Other data in the US showed that the labor market remains tight as Initial Jobless Claims for the week ending April 20 missed estimates of 214K, coming at 207K, less than the previous reading.
- Data from the Chicago Board of Trade (CBOT) suggests that traders expect the Fed funds rate to finish 2024 at 5.035%, up from 4.98% on Wednesday.
Technical analysis: Mexican Peso on backfoot as USD/MXN rallies toward 200-day SMA
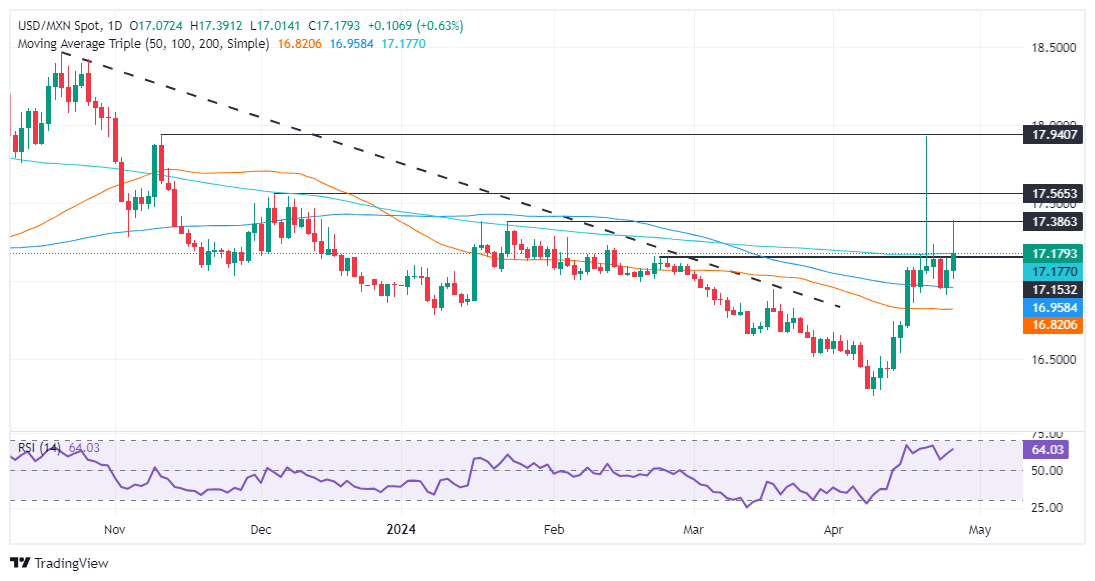
The Mexican Peso downtrend continues as the USD/MXN has cleared the 200-day Simple Moving Average (SMA) at 17.16. The rally was capped at the January 23 swing high of 17.38. The exotic pair has retreated since then.
If USD/MXN sellers drag spot prices below the 200-day SMA, look for a retest of the 17.00 figure. Subsequent losses are seen, once cleared, with the next support being the 50-day SMA at 16.81 before challenging last year’s low of 16.62.
On the other hand, if buyers achieve a daily close above the 200-day SMA, look for another test of 17.38. A breach of the latter will expose the 18.00 figure, followed by the year-to-date (YTD) high at 17.92.
Mexican Peso FAQs
The Mexican Peso (MXN) is the most traded currency among its Latin American peers. Its value is broadly determined by the performance of the Mexican economy, the country’s central bank’s policy, the amount of foreign investment in the country and even the levels of remittances sent by Mexicans who live abroad, particularly in the United States. Geopolitical trends can also move MXN: for example, the process of nearshoring – or the decision by some firms to relocate manufacturing capacity and supply chains closer to their home countries – is also seen as a catalyst for the Mexican currency as the country is considered a key manufacturing hub in the American continent. Another catalyst for MXN is Oil prices as Mexico is a key exporter of the commodity.
The main objective of Mexico’s central bank, also known as Banxico, is to maintain inflation at low and stable levels (at or close to its target of 3%, the midpoint in a tolerance band of between 2% and 4%). To this end, the bank sets an appropriate level of interest rates. When inflation is too high, Banxico will attempt to tame it by raising interest rates, making it more expensive for households and businesses to borrow money, thus cooling demand and the overall economy. Higher interest rates are generally positive for the Mexican Peso (MXN) as they lead to higher yields, making the country a more attractive place for investors. On the contrary, lower interest rates tend to weaken MXN.
Macroeconomic data releases are key to assess the state of the economy and can have an impact on the Mexican Peso (MXN) valuation. A strong Mexican economy, based on high economic growth, low unemployment and high confidence is good for MXN. Not only does it attract more foreign investment but it may encourage the Bank of Mexico (Banxico) to increase interest rates, particularly if this strength comes together with elevated inflation. However, if economic data is weak, MXN is likely to depreciate.
As an emerging-market currency, the Mexican Peso (MXN) tends to strive during risk-on periods, or when investors perceive that broader market risks are low and thus are eager to engage with investments that carry a higher risk. Conversely, MXN tends to weaken at times of market turbulence or economic uncertainty as investors tend to sell higher-risk assets and flee to the more-stable safe havens.
Recommended Articles


