NZD/USD Price Analysis: Extends winning spell to 0.5960

Source Fxstreet
  • NZD/USD rises to 0.5960 as US Dollar exhibits a weak footing ahead of US Q1 GDP data.
  • The consensus shows that the US economy expanded by 2.5% in the January-March period.
  • The New Zealand Dollar moves higher on improved demand for risk-perceived currencies.

The NZD/USD pair extends its winning streak for the fourth trading session on Thursday. The Kiwi asset movers higher to 0.5960 as the US Dollar falls further amid concerns over United States economic outlook due to a sharp decline in new business inflows in April, showed by S&P Global preliminary PMI report. The US Dollar Index (DXY), which tracks the US Dollar’s value against six major currencies, drops to 10-day low near 105.50.

Downside move in the US Dollar has improved demand for risk-sensitive currencies. However, the market sentiment remains uncertain as investors turn attention to the preliminary US Q1 GDP data, which will be published at 12:30 GMT. The US economy is projected to have grown at a moderate pace of 2.5% against 3.4% growth witnessed in the final quarter of the last year.

Going forward, investors will also watch the US core Personal Consumption Expenditure Price Index (PCE) data for March, which is a Fed’s preferred inflation measure. The inflation measures is estimated to have grown steadily by 0.3% on a month-on-month basis. This will influence speculation for Federal reserve (Fed) rate cuts, which are currently anticipated from the September meeting.

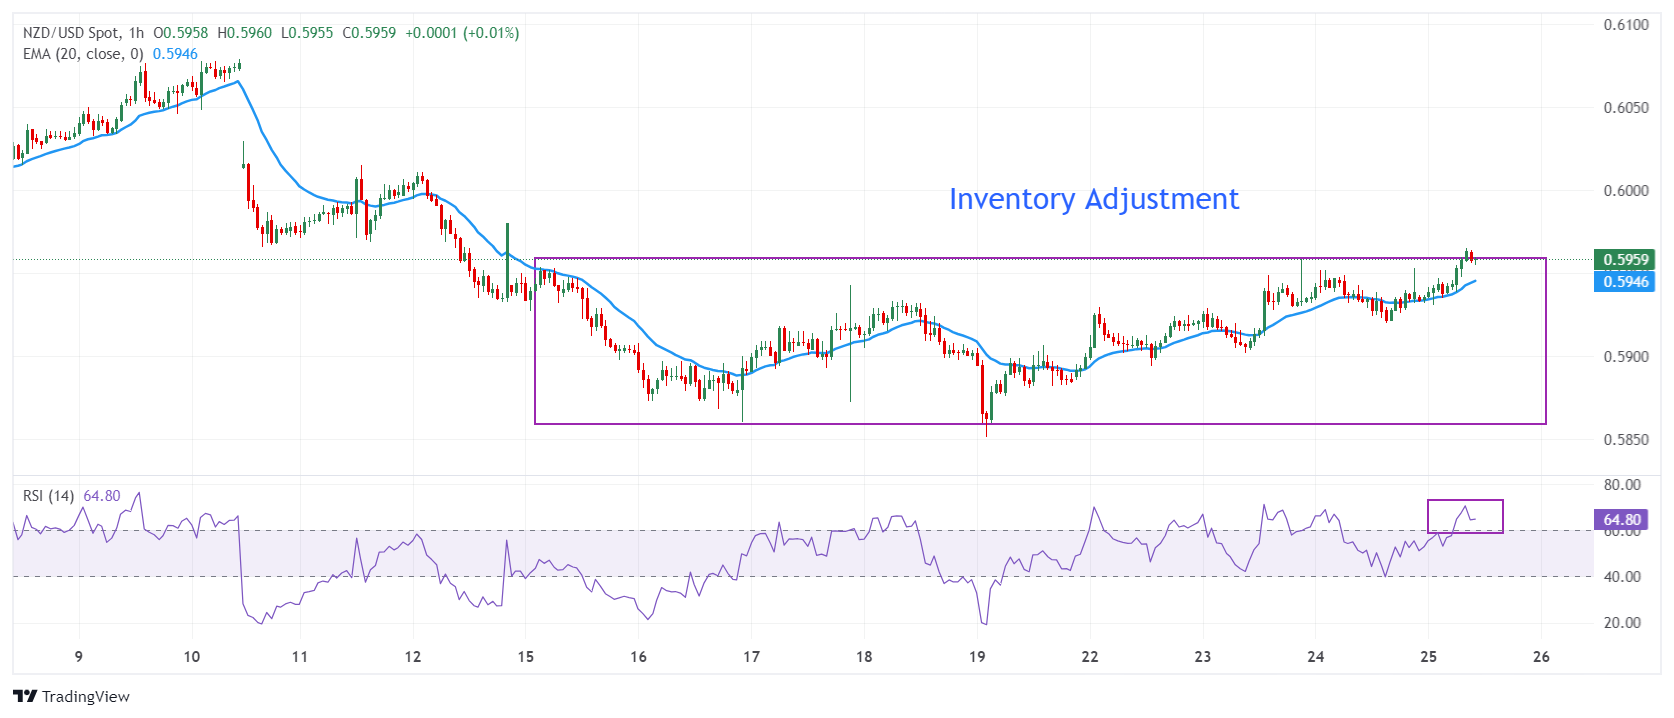
NZD/USD trades close to the upper-end of the inventory adjustment phase in which Kiwi positions are exchanged between institutional investors and retail participants. It is difficult to designate the phase as “accumulation” or “distribution” before a decisive break. The Kiwi asset is expected to deliver a decisive move after the release of the US Q1 GDP data.

Upward-sloping 20-period Exponential Moving Average (EMA) at 0.5947 signifies a bullish near-term appeal for the New Zealand Dollar.

The 14-period Relative Strength Index (RSI) rises above 60.00, suggesting a fresh upside momentum has been triggered.

Further upside above the psychological resistance of 0.6000 will drive the asset towards April 4 high around 0.6050 and the round-level resistance of 0.6100.

On the contrary, a fresh downside would appear if the asset breaks below April 16 low at 0.5860. This would drag the asset toward 8 September 2023 low at 0.5847, followed by the round-level support of 0.5900

NZD/USD hourly chart

NZD/USD

Overview
Today last price 0.5958
Today Daily Change 0.0023
Today Daily Change % 0.39
Today daily open 0.5935
 
Trends
Daily SMA20 0.5961
Daily SMA50 0.6052
Daily SMA100 0.6117
Daily SMA200 0.605
 
Levels
Previous Daily High 0.5958
Previous Daily Low 0.592
Previous Weekly High 0.5954
Previous Weekly Low 0.5851
Previous Monthly High 0.6218
Previous Monthly Low 0.5956
Daily Fibonacci 38.2% 0.5944
Daily Fibonacci 61.8% 0.5935
Daily Pivot Point S1 0.5917
Daily Pivot Point S2 0.5899
Daily Pivot Point S3 0.5879
Daily Pivot Point R1 0.5956
Daily Pivot Point R2 0.5976
Daily Pivot Point R3 0.5994


Disclaimer: For information purposes only. Past performance is not indicative of future results.
placeholder
Bitcoin Rout. Bridgewater Founder Dalio Publicly Backs Gold.Gold returns to the $5,000 mark as Bitcoin prices weaken to hit new lows; what is the future outlook?During the Asian session on Wednesday (February 4), gold ( XAUUSD) prices continued to
Author  TradingKey
11 hours ago
Gold returns to the $5,000 mark as Bitcoin prices weaken to hit new lows; what is the future outlook?During the Asian session on Wednesday (February 4), gold ( XAUUSD) prices continued to
placeholder
Gold rallies further beyond $5,050 amid flight to safety, dovish Fed expectationsGold (XAU/USD) attracts follow-through buying for the second consecutive day and surges past the $5,000 psychological mark during the Asian session on Wednesday amid the global flight to safety.
Author  FXStreet
13 hours ago
Gold (XAU/USD) attracts follow-through buying for the second consecutive day and surges past the $5,000 psychological mark during the Asian session on Wednesday amid the global flight to safety.
placeholder
Bitcoin Bottom Debate: $70,000 or $50,000? Where is the Bitcoin bottom? Can you buy the dip now? Cathie Wood suggests swapping gold for Bitcoin.On Tuesday (February 3), panic in the crypto market eased as Bitcoin ( BTC) prices reb
Author  TradingKey
Yesterday 10: 30
Where is the Bitcoin bottom? Can you buy the dip now? Cathie Wood suggests swapping gold for Bitcoin.On Tuesday (February 3), panic in the crypto market eased as Bitcoin ( BTC) prices reb
placeholder
Bitcoin Reaches ‘Fire-Sale’ Valuations as ETF Outflows Jump, Says BitwiseBitcoin’s two-year rolling MVRV z-score has dropped to its lowest level ever, pointing to extreme undervaluation.
Author  Mitrade
Yesterday 10: 25
Bitcoin’s two-year rolling MVRV z-score has dropped to its lowest level ever, pointing to extreme undervaluation.
placeholder
Analyst Flags XRP as Market’s ‘Best Risk/Reward’ Play as Token Tests Critical $1.60 SupportCrypto analyst Scott Melker identifies a prime risk/reward setup for XRP as it tests key support at $1.60, offering a tight stop-loss against potential upside targets near $2.00.
Author  Mitrade
Yesterday 06: 24
Crypto analyst Scott Melker identifies a prime risk/reward setup for XRP as it tests key support at $1.60, offering a tight stop-loss against potential upside targets near $2.00.
goTop
quote