NZD/JPY Price Analysis: Buyers dominance diminishes, market could favor sellers soon

Source Fxstreet
  • The daily RSI shows that buyers' hold over the market is likely fading, signaling the growing presence of sellers.
  • On the hourly chart, indicators underline a prominent seller command in the past sessions.

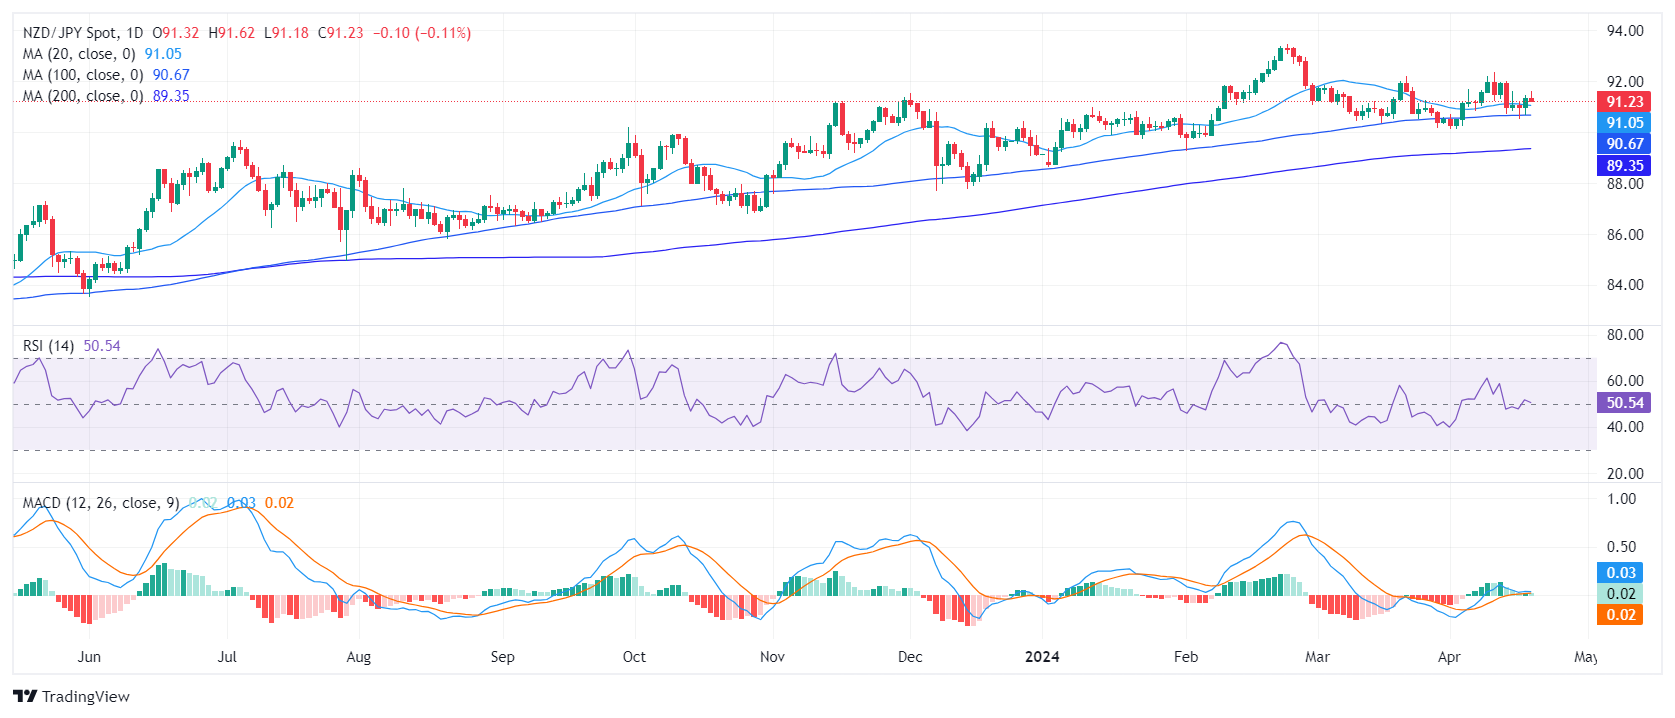
The NZD/JPY is trading slightly lower at around 91.23. It seems the firm grip buyers had over the market is dwindling, yet the pair doggedly persists above crucial Simple Moving Averages (SMAs). Market watchers should eye the short-term trajectory of the NZD/JPY for any potential shifts that could give sellers the upper hand. Specifically, if bears breach the 20-day Simple Moving Average (SMA) at 91.00.

On the daily RSI fluctuates around the positive region but is currently pointing down. This, combined with the rising red bars trend in the MACD (Moving Average Converge Divergence) histogram, indicates that buyer dominance is fading and the market could begin favoring sellers soon.

NZD/JPY daily chart
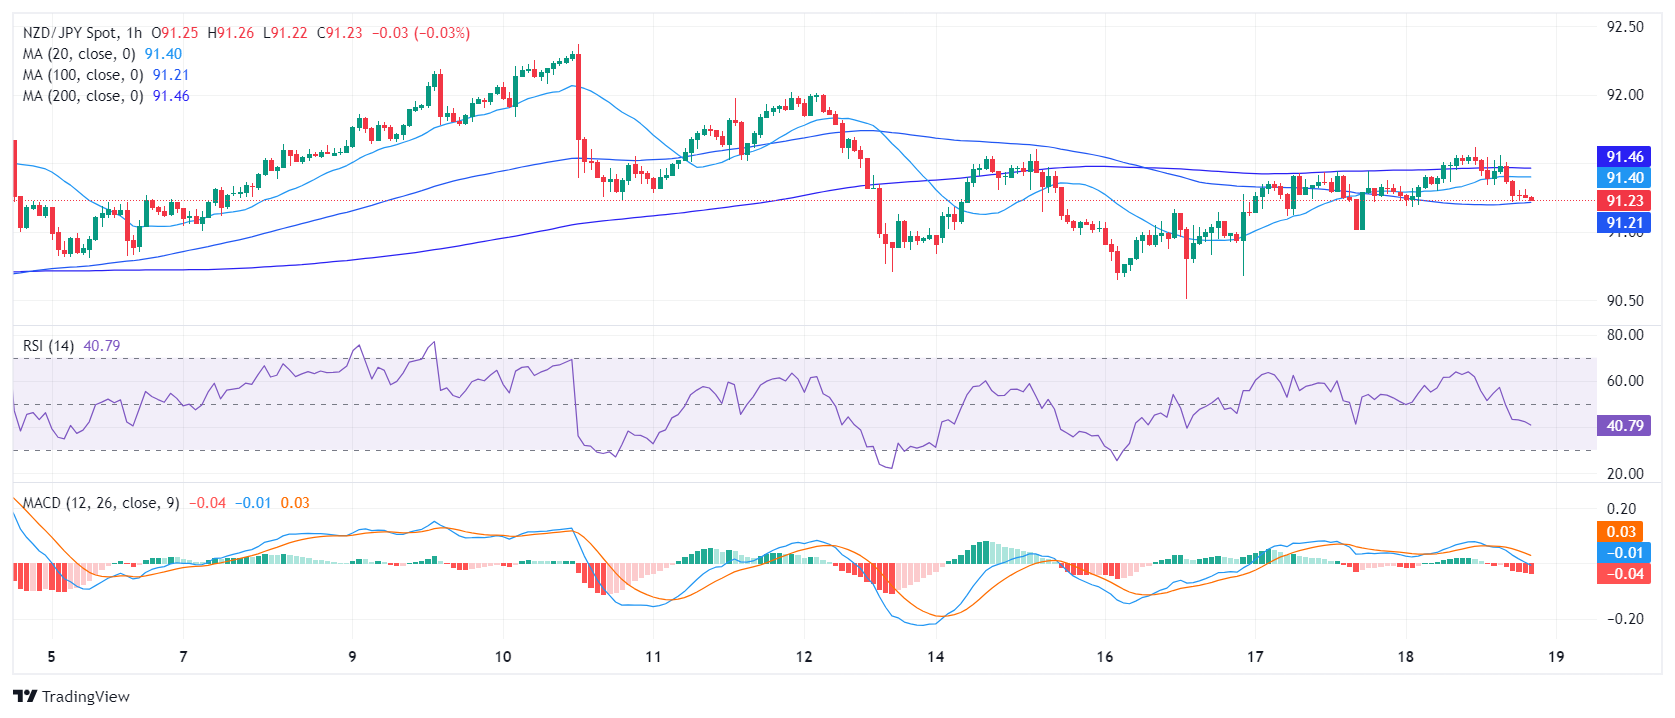
In addition, the hourly Relative Strength Index (RSI) hovers below the neutral 50 line, reflecting a dominant presence of sellers in the recent sessions. The negative thrust is confirmed by the MACD, which reveals decreasing green bars, indicating diminishing positive momentum.

NZD/JPY hourly chart
Upon evaluating the broader landscape, the NZD/JPY is currently hovering above its key Simple Moving Averages (SMAs), reflecting continued buying pressure thereby sustaining the long-term uptrend. However, the pair closely challenges the 20-day SMA, suggesting potential for further downward movements if this level doesn’t hold. Moreover, the pair maintaining a stance above the 100 and 200-day SMAs reinforces a long-term bullish view.


NZD/JPY

Overview
Today last price 91.28
Today Daily Change -0.04
Today Daily Change % -0.04
Today daily open 91.32
 
Trends
Daily SMA20 91.07
Daily SMA50 91.43
Daily SMA100 90.67
Daily SMA200 89.34
 
Levels
Previous Daily High 91.44
Previous Daily Low 90.67
Previous Weekly High 92.37
Previous Weekly Low 90.7
Previous Monthly High 92.2
Previous Monthly Low 90.17
Daily Fibonacci 38.2% 91.15
Daily Fibonacci 61.8% 90.97
Daily Pivot Point S1 90.85
Daily Pivot Point S2 90.38
Daily Pivot Point S3 90.08
Daily Pivot Point R1 91.62
Daily Pivot Point R2 91.92
Daily Pivot Point R3 92.39


Disclaimer: For information purposes only. Past performance is not indicative of future results.
placeholder
Top 3 Price Prediction: Bitcoin, Ethereum, Ripple – BTC, ETH and XRP Look for a Foothold After a Sharp ShakeoutBitcoin trades near $92,600 after a dip below $90,000, while Ethereum around $3,118 and XRP near $2.21–$2.23 sit on key support zones, as BTC, ETH and XRP all try to turn a sharp correction into a tradable rebound rather than a deeper slide.
Author  Mitrade
Nov 19, Wed
Bitcoin trades near $92,600 after a dip below $90,000, while Ethereum around $3,118 and XRP near $2.21–$2.23 sit on key support zones, as BTC, ETH and XRP all try to turn a sharp correction into a tradable rebound rather than a deeper slide.
placeholder
Bitcoin Volatility Spikes: Is Options-Driven Pricing Making a Comeback?Bitcoin's volatility is surging, suggesting a shift back to options-driven price action seen before Bitcoin ETFs were launched.
Author  Mitrade
Yesterday 03: 23
Bitcoin's volatility is surging, suggesting a shift back to options-driven price action seen before Bitcoin ETFs were launched.
placeholder
2025 Black Friday is coming! Which stocks may see volatility?Coming on the day right after Thanksgiving in the United States, Back Friday marks the start of the holiday shopping season. Sales data from this shopping frenzy day reflects investor confidence and consumer trends. The National Retail Federation (NRF) predicts that holiday season (Nov and Dec) retail sales in 2025 will likely exceed $1 trillion for the very first time, which represents a year-over-year increase of 3.7 to 4.2 percent. Historic data from the past decade show that the retail sector has generally outperformed the S&P 500 during the weeks before and after Black Friday. The following retailing companies are expected to be big winners:
Author  Insights
Yesterday 05: 37
Coming on the day right after Thanksgiving in the United States, Back Friday marks the start of the holiday shopping season. Sales data from this shopping frenzy day reflects investor confidence and consumer trends. The National Retail Federation (NRF) predicts that holiday season (Nov and Dec) retail sales in 2025 will likely exceed $1 trillion for the very first time, which represents a year-over-year increase of 3.7 to 4.2 percent. Historic data from the past decade show that the retail sector has generally outperformed the S&P 500 during the weeks before and after Black Friday. The following retailing companies are expected to be big winners:
placeholder
Top 3 Price Prediction: Bitcoin, Ethereum, Ripple – BTC, ETH and XRP Attempt Recovery Post-SelloffBitcoin trades back above $87,700 after a 20% drop, while Ethereum rebounds from support around $2,749 and XRP recovers above $2.08 off its $1.96 floor, as BTC, ETH and XRP all try to turn last week’s steep correction into the start of a broader recovery.
Author  Mitrade
Yesterday 05: 58
Bitcoin trades back above $87,700 after a 20% drop, while Ethereum rebounds from support around $2,749 and XRP recovers above $2.08 off its $1.96 floor, as BTC, ETH and XRP all try to turn last week’s steep correction into the start of a broader recovery.
placeholder
Gold Price Forecast: XAU/USD rises to near $4,150 as Fed rate cut bets growGold price (XAU/USD) attracts some buyers to around $4,140 during the early Asian session on Tuesday. The precious metal rises on growing expectations of a US Federal Reserve (Fed) interest rate cut in the December policy meeting.
Author  FXStreet
13 hours ago
Gold price (XAU/USD) attracts some buyers to around $4,140 during the early Asian session on Tuesday. The precious metal rises on growing expectations of a US Federal Reserve (Fed) interest rate cut in the December policy meeting.
goTop
quote