NZD/USD Price Analysis: Downward trend likely to continue despite indicators recovering

Source Fxstreet
  • The RSI on the daily chart lies deep in negative terrain but recovered.
  • The hourly RSI paints a growing buying momentum, trending the positive territory.
  • The MACD on both charts signals a less intense selling momentum.

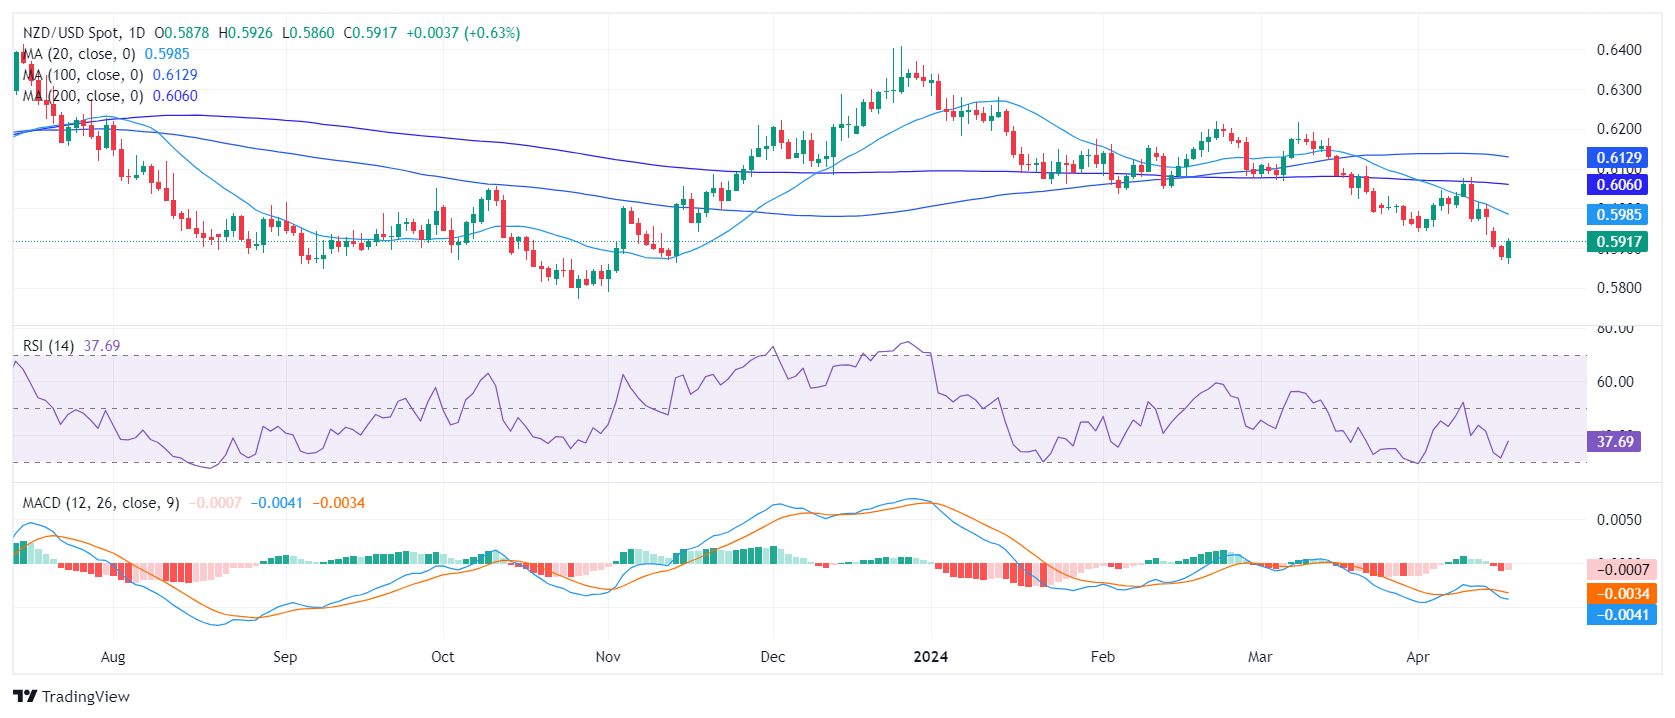
The NZD/USD stands recovered to 0.5919, it seeing 0.60% gains. The dominant sentiment remains bearish, subtly dominated by sellers due to the consistent positioning beneath key Simple Moving Averages (SMAs). However, indicators on the daily and hourly charts seem to be recovering.

On the daily chart, the Relative Strength Index (RSI) demonstrates a negative sentiment as it continues an under-50 trend. Although there was a slight uptick from the recent low point seen on Monday, the RSI remains in deep in negative territory. Moreover, the Moving Average Convergence Divergence (MACD) displays falling red bars, reinforcing a weakening bearish momentum.

NZD/USD daily chart
The hourly chart presents an interesting contrast. Here, recent RSI readings consistently float above 50, marking a positive territory. The latest reading is 57, revealing that buyers are taking the reins on the hourly scale. The MACD histogram echoes the buying momentum printing rising green bars.

NZD/USD hourly chart
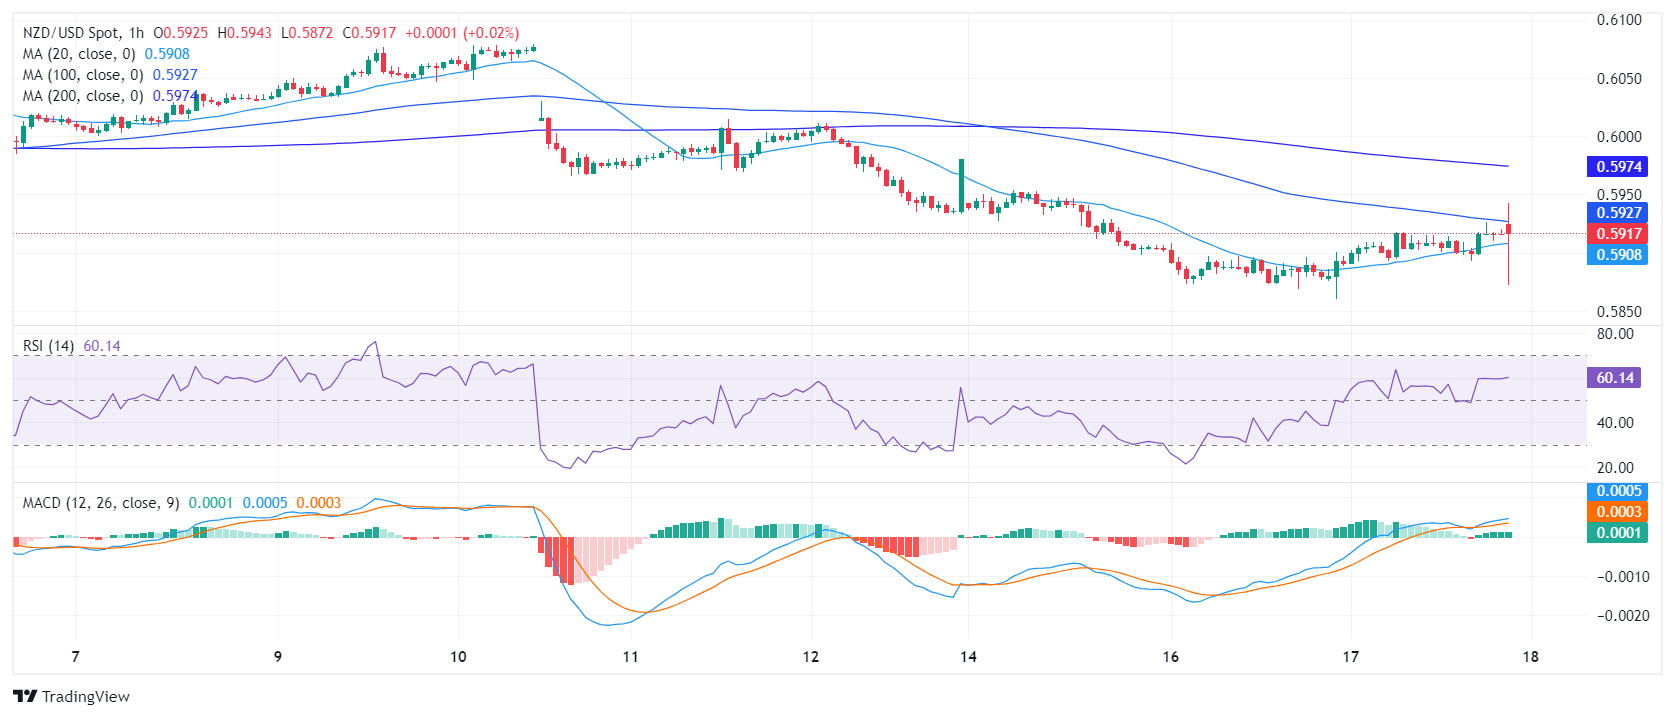
Upon examining the long-term trend, it becomes apparent that the NZD/USD exhibits bearish momentum as it slots below the 20-day, 100-day, and 200-day Simple Moving Average (SMA) indicators. So any movements which keeps the pair beneath these levels shouldn't be considered as a clear buying signal.

NZD/USD

Overview
Today last price 0.5917
Today Daily Change 0.0037
Today Daily Change % 0.63
Today daily open 0.588
 
Trends
Daily SMA20 0.5993
Daily SMA50 0.6075
Daily SMA100 0.6132
Daily SMA200 0.6062
 
Levels
Previous Daily High 0.5908
Previous Daily Low 0.5868
Previous Weekly High 0.6079
Previous Weekly Low 0.5933
Previous Monthly High 0.6218
Previous Monthly Low 0.5956
Daily Fibonacci 38.2% 0.5884
Daily Fibonacci 61.8% 0.5893
Daily Pivot Point S1 0.5863
Daily Pivot Point S2 0.5846
Daily Pivot Point S3 0.5823
Daily Pivot Point R1 0.5902
Daily Pivot Point R2 0.5925
Daily Pivot Point R3 0.5942


Disclaimer: For information purposes only. Past performance is not indicative of future results.
placeholder
USD/CAD Price Forecast: Eyes fresh six-month highs near 1.4150 within overbought zoneThe technical analysis of the daily chart indicates a prevailing bullish bias, with the pair remaining within the ascending channel pattern.
Author  FXStreet
Yesterday 10: 04
The technical analysis of the daily chart indicates a prevailing bullish bias, with the pair remaining within the ascending channel pattern.
placeholder
Dow Jones futures gain amid easing US-China tensions, Michigan Consumer Sentiment awaitedDow Jones futures advance 0.20% to trade above 47,100 during European hours ahead of the opening of the United States (US) regular session on Friday.
Author  FXStreet
Yesterday 10: 01
Dow Jones futures advance 0.20% to trade above 47,100 during European hours ahead of the opening of the United States (US) regular session on Friday.
placeholder
Gold draws support from safe-haven flows and Fed rate cut betsGold catches fresh bids on the last day of the week amid reviving safe-haven demand.
Author  FXStreet
Yesterday 07: 11
Gold catches fresh bids on the last day of the week amid reviving safe-haven demand.
placeholder
WTI Price Forecast: Trades with modest gains below $60.00; not out of the woods yetFrom a technical perspective, the black liquid has been trending lower along a downward-sloping channel since late October.
Author  FXStreet
Yesterday 06: 41
From a technical perspective, the black liquid has been trending lower along a downward-sloping channel since late October.
placeholder
GBP/USD edges lower to near 1.3100 on potential for further BoE rate cutsThe pair depreciates as the Pound Sterling (GBP) weakens following the Bank of England’s (BoE) dovish hold in November.
Author  FXStreet
Yesterday 06: 06
The pair depreciates as the Pound Sterling (GBP) weakens following the Bank of England’s (BoE) dovish hold in November.
Related Instrument
goTop
quote