EUR/USD holds gains ahead of Eurozone business activity figures

Source Fxstreet
  • The EUR/USD trades broadly steady at 1.1750, with highs of 1.1760-1.1770 in focus.
  • Eurozone PMIs are expected to show a slight improvement in business activity in December.
  • The EUR/USD rally starts giving signs of exhaustion.

EUR/USD remains steady near two-and-a-half-month highs on Tuesday, trading practically flat at 1.1750 at the time of writing, ahead of the release of the preliminary Eurozone Manufacturing and Services Purchasing Managers Indexes (PMIs) for December and the delayed US employment figures.

Markets are in a moderate risk-off mood. Most Asian stock markets have posted losses, and the main European equity index futures are pointing to a negative opening, which keeps Euro (EUR) bulls in check. The US Dollar Index (DXY), on the other hand, remains pinned near multi-month lows, which is keeping the EUR/USD's downside attempts limited.

During the US market session, the Bureau of Labor Statistics will release the Nonfarm Payrolls reports for October and November. These figures are expected to provide further insight into the momentum of the US labour market, although the lack of key data, which was not collected during the government shutdown, will deprive traders of the full picture.

Euro Price Today

The table below shows the percentage change of Euro (EUR) against listed major currencies today. Euro was the strongest against the Swiss Franc.

USD EUR GBP JPY CAD AUD NZD CHF
USD -0.02% -0.00% -0.26% -0.04% -0.03% -0.02% 0.00%
EUR 0.02% 0.01% -0.22% -0.03% -0.02% 0.00% 0.02%
GBP 0.00% -0.01% -0.25% -0.04% -0.03% -0.02% 0.00%
JPY 0.26% 0.22% 0.25% 0.20% 0.21% 0.21% 0.24%
CAD 0.04% 0.03% 0.04% -0.20% 0.00% 0.01% 0.05%
AUD 0.03% 0.02% 0.03% -0.21% -0.01% 0.01% 0.04%
NZD 0.02% 0.00% 0.02% -0.21% -0.01% -0.01% 0.02%
CHF -0.01% -0.02% -0.00% -0.24% -0.05% -0.04% -0.02%

The heat map shows percentage changes of major currencies against each other. The base currency is picked from the left column, while the quote currency is picked from the top row. For example, if you pick the Euro from the left column and move along the horizontal line to the US Dollar, the percentage change displayed in the box will represent EUR (base)/USD (quote).

Daily Digest Market Movers: The US Dollar remains depressed ahead of US employment data

  • The Euro (EUR) remains supported near recent highs as investors continue to bet on further interest rate cuts by the Federal Reserve (Fed). The European Central Bank (ECB) is widely expected to keep rates on hold at Thursday's meeting, and might even hint at a rate hike in the second half of 2026.
  • Data from the US released on Monday failed to support the US Dollar. The New York Empire State Manufacturing Index fell to -3.9 in December, below the 10.6 reading forecasted by the market and also below November's 18.7 reading.
  • In the Eurozone, on the other hand, Industrial Production data beat expectations with a 0.8% growth in October, from 0.2% in September, and market forecasts of a mere 0.1% advance. Year-on-year, industrial production increased 2%, from the 1.2% growth seen in September.
  • Beyond that, negotiations for a peace deal in Ukraine continue. US offered NATO-style security guarantees to Kiev after US President Donald Trump and Ukrainian President Volodymyr Zelenskyy's meeting in Berlin, which has provided some support to the Euro.
  • Later on Tuesday, Eurozone Services PMI is expected to have edged up to 53.9 in December, from 53.6 in November, while the Manufacturing PMI is seen ticking up to 49.9 from 49.6 but still within levels consistent with a contracting business activity.
  • In the US, Nonfarm Payrolls data are expected to show a 40K net increase in payrolls in November, with the Unemployment Rate steady at 4.4%. October's payroll figures will also be out, although the jobless rate will not be released due to a lack of data.
  • At the same time, the US Commerce Department will release October's Retail Sales, which are expected to have grown 0.2%, the same pace as in September. Excluding automobiles, US retail consumption is expected to have risen 0.2%, slightly below September's 0.3% growth.

Technical Analysis: EUR/USD rally starts to give signs of exhaustion

EUR/USD Chart
EUR/USD 4-Hour Chart


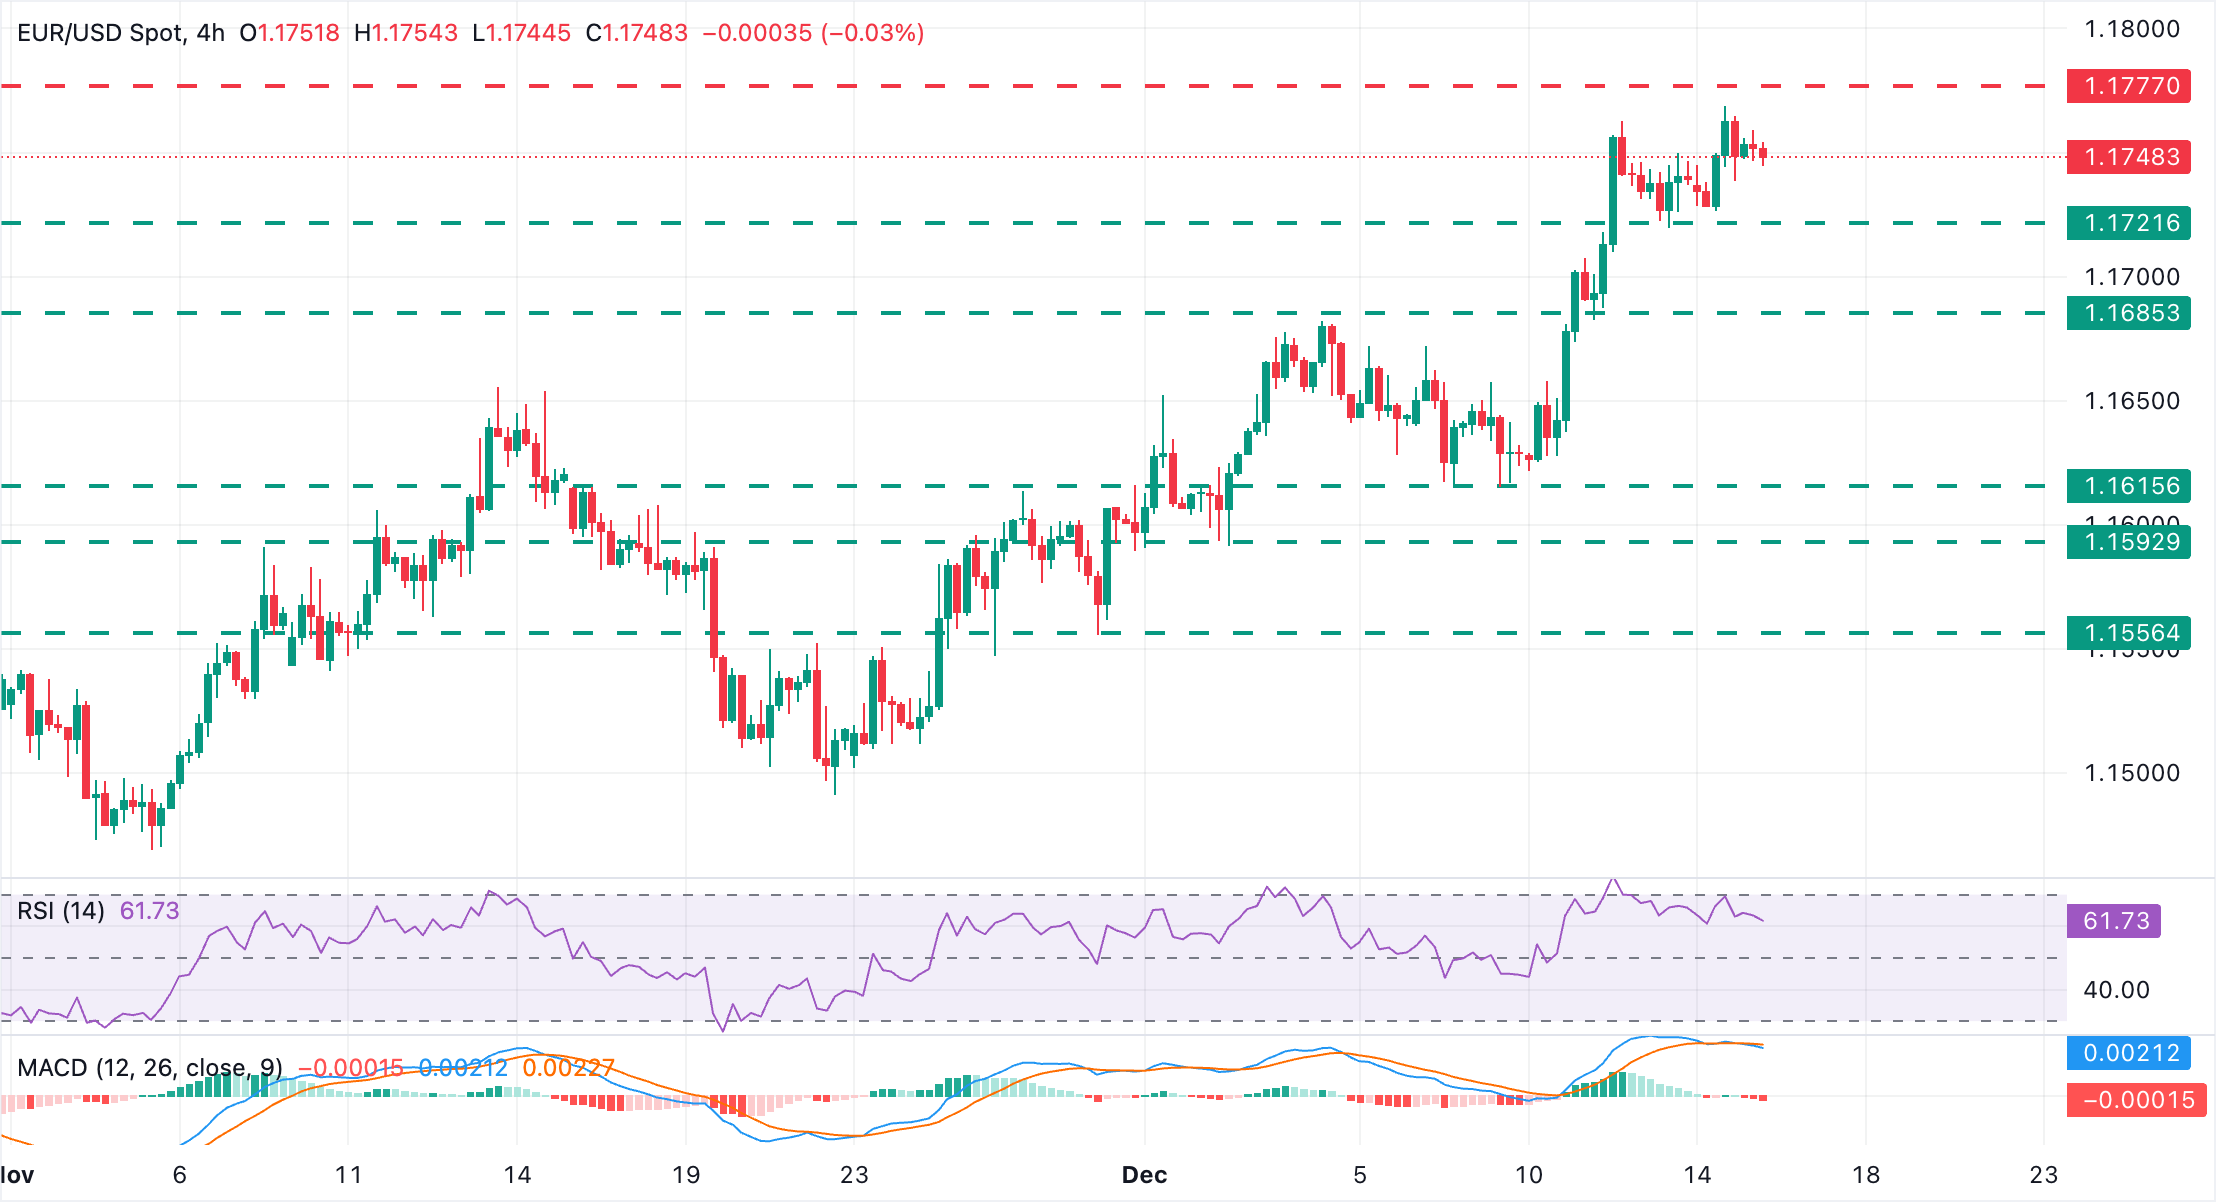
The EUR/USD maintains its bullish trend intact, but Monday's upside attempts failed to confirm above last week's high at 1.1763, and technical indicators are pointing to a weakening momentum. The. 4-hour Relative Strength Index (RSI) is showing a bearish divergence, although still at levels within bullish territory. Meanwhile, the Moving Average Convergence Divergence (MACD) indicator has recently crossed below the signal line, hinting at a deeper correction.

Immediate support is at the December 12 low, near 1.1720. Below that, the December 11 low at the 1.1685 area, and the December 9 low at 1.1615 will emerge as the next bearish targets. To the upside, the 1.1760-1.1770 area has capped bulls on December 11 and 15, ahead of the October 1 peak at around 1.1780. The pair has a significant resistance area here, which should be cleared to shift the focus towards the September 23 and 24 highs near 1.1820.

Economic Indicator

HCOB Manufacturing PMI

The Manufacturing Purchasing Managers Index (PMI), released on a monthly basis by S&P Global and Hamburg Commercial Bank (HCOB), is a leading indicator gauging business activity in the Eurozone manufacturing sector. The data is derived from surveys of senior executives at private-sector companies from the manufacturing sector. Survey responses reflect the change, if any, in the current month compared to the previous month and can anticipate changing trends in official data series such as Gross Domestic Product (GDP), industrial production, employment and inflation. The index varies between 0 and 100, with levels of 50.0 signaling no change over the previous month. A reading above 50 indicates that the manufacturing economy is generally expanding, a bullish sign for the Euro (EUR). Meanwhile, a reading below 50 signals that activity among goods producers is generally declining, which is seen as bearish for EUR.

Read more.

Next release: Tue Dec 16, 2025 09:00 (Prel)

Frequency: Monthly

Consensus: 49.9

Previous: 49.6

Source: S&P Global

Economic Indicator

HCOB Services PMI

The Services Purchasing Managers Index (PMI), released on a monthly basis by S&P Global and Hamburg Commercial Bank (HCOB), is a leading indicator gauging business activity in the Eurozone services sector. As the services sector dominates a large part of the economy, the Services PMI is an important indicator gauging the state of overall economic conditions. The data is derived from surveys of senior executives at private-sector companies from the services sector. Survey responses reflect the change, if any, in the current month compared to the previous month and can anticipate changing trends in official data series such as Gross Domestic Product (GDP), industrial production, employment and inflation. The index varies between 0 and 100, with levels of 50.0 signaling no change over the previous month. A reading above 50 indicates that the services economy is generally expanding, a bullish sign for the Euro (EUR). Meanwhile, a reading below 50 signals that activity among services providers is generally declining, which is seen as bearish for EUR.

Read more.

Next release: Tue Dec 16, 2025 09:00 (Prel)

Frequency: Monthly

Consensus: 53.9

Previous: 53.6

Source: S&P Global

Disclaimer: For information purposes only. Past performance is not indicative of future results.
placeholder
Gold Price Forecast: XAU/USD drifts higher above $4,200 as Fed delivers expected cutGold price (XAU/USD) gains momentum to around $4,235 during the early Asian session on Thursday. The precious metal extends its upside after the US Federal Reserve (Fed) delivered an expected third consecutive interest rate cut and maintained its outlook for just one cut in 2026.
Author  FXStreet
Dec 11, Thu
Gold price (XAU/USD) gains momentum to around $4,235 during the early Asian session on Thursday. The precious metal extends its upside after the US Federal Reserve (Fed) delivered an expected third consecutive interest rate cut and maintained its outlook for just one cut in 2026.
placeholder
Gold remains bid as lack of Fed clarity and geopolitical frictions persistGold (XAU/USD) advances modestly on Friday as traders seem to book profits ahead of the weekend, yet clings to gains of over 0.51% after reaching a seven-week high of $4,353. At the time of writing, XAU/USD trades at $4,302 as traders digest comments from Federal Reserve (Fed) officials.
Author  FXStreet
Yesterday 01: 34
Gold (XAU/USD) advances modestly on Friday as traders seem to book profits ahead of the weekend, yet clings to gains of over 0.51% after reaching a seven-week high of $4,353. At the time of writing, XAU/USD trades at $4,302 as traders digest comments from Federal Reserve (Fed) officials.
placeholder
Ethereum Price Slips Lower — $3,000 Looms as the Key BattlegroundEthereum is attempting to recover from a $3,026 low but remains below $3,200 and the 100-hour SMA, with a bearish trend line near $3,175 capping rebounds as bulls need a clean break above $3,200 to target $3,250–$3,400, while a drop below $3,050 risks a retest of $3,000 and $2,940.
Author  Mitrade
Yesterday 03: 25
Ethereum is attempting to recover from a $3,026 low but remains below $3,200 and the 100-hour SMA, with a bearish trend line near $3,175 capping rebounds as bulls need a clean break above $3,200 to target $3,250–$3,400, while a drop below $3,050 risks a retest of $3,000 and $2,940.
placeholder
Macro Analysts: Hawkish Japan Could Push Bitcoin Below $70KAnalysts predict Bitcoin may face further declines towards the $70,000 mark if the Bank of Japan raises interest rates as expected.
Author  Mitrade
Yesterday 05: 48
Analysts predict Bitcoin may face further declines towards the $70,000 mark if the Bank of Japan raises interest rates as expected.
placeholder
Bitcoin Slides 5% as Sellers Lean In — Can BTC Reclaim $88,000?Bitcoin has dropped back below $88,000 after rolling over from $90,500, with price still trading under the 100-hour Simple Moving Average. The sell-off found a floor at $85,151, and BTC is now consolidating near that base, but rebounds are facing pressure from a bearish trend line around $89,000. Bulls need to retake $88,000–$89,000 to ease downside risk; failure to do so keeps $85,500–$85,000 and then $83,500 in play, with $80,000 as the deeper “line in the sand.” Bitcoin (BTC) is back in damage-control mode after a sharp pullback wiped out recent gains. The price failed to reclaim the $90,000–$90,500 band, rolled over, and slid through $88,500 before briefly dipping under $87,000. Buyers did show up around $85,000, but the rebound so far looks more like stabilization than a clear trend reversal. Bitcoin dips hard, finds a bid near $85,000(h3) BTC’s latest move lower began when it couldn’t build follow-through above $90,000 and $90,500. Once that upside stalled, sellers took control and pushed price down through $88,500. The slide accelerated enough to spike below $87,000, but the market didn’t free-fall. Bulls defended the $85,000 zone, printing a low at $85,151. Since then, Bitcoin has been consolidating below the 23.6% Fibonacci retracement of the drop from the $93,560 swing high to the $85,151 low — a clue that the bounce is still shallow and that sellers haven’t fully backed off yet. Structurally, BTC is still on the back foot: It’s trading below $88,000, and It remains below the 100-hour Simple Moving Average, keeping short-term trend pressure pointed downward. Resistance is layered, and $89,000 is the problem area(h3) If bulls try to turn this into a recovery, they’ll have to climb through multiple ceilings in quick succession. First, BTC faces resistance around $87,150, followed by a more meaningful barrier near $87,500. From there, the market’s attention snaps back to $88,000 — the level BTC just lost and now needs to reclaim. A close back above $88,000 would improve the tone, but it doesn’t solve the bigger issue: there’s a bearish trend line on the hourly BTC/USD chart (Kraken feed) with resistance near $89,000, which also lines up with the next technical hurdle. If BTC can push through $89,000 and hold, the rebound could extend toward $90,000, with follow-through targets at $91,000 and $91,500. But until price clears that $88,000–$89,000 zone, rallies are at risk of being sold rather than chased. If BTC fails to reclaim resistance, the downside path is clear(h3) The near-term bear case is simple: if Bitcoin can’t climb back above the $87,000 area and keep traction, sellers may attempt another leg lower. Support levels line up like this: Immediate support: $85,500 First major support: $85,000 Next support: $83,500 Then $82,500 in the near term Below that, the major “don’t break this” level is still $80,000. If BTC slips under $80,000, the risk of acceleration to the downside increases significantly — not because it’s magic, but because it’s the kind of psychological and structural level that tends to trigger forced de-risking. Indicators: momentum still leans bearish(h3) The intraday indicators aren’t offering much comfort yet: Hourly MACD is losing pace in the bearish zone. Hourly RSI remains below 50, suggesting sellers still have the upper hand on short timeframes. So while the $85,000 defense held for now, the market hasn’t flipped bullish — it’s just stopped bleeding.
Author  Mitrade
9 hours ago
Bitcoin has dropped back below $88,000 after rolling over from $90,500, with price still trading under the 100-hour Simple Moving Average. The sell-off found a floor at $85,151, and BTC is now consolidating near that base, but rebounds are facing pressure from a bearish trend line around $89,000. Bulls need to retake $88,000–$89,000 to ease downside risk; failure to do so keeps $85,500–$85,000 and then $83,500 in play, with $80,000 as the deeper “line in the sand.” Bitcoin (BTC) is back in damage-control mode after a sharp pullback wiped out recent gains. The price failed to reclaim the $90,000–$90,500 band, rolled over, and slid through $88,500 before briefly dipping under $87,000. Buyers did show up around $85,000, but the rebound so far looks more like stabilization than a clear trend reversal. Bitcoin dips hard, finds a bid near $85,000(h3) BTC’s latest move lower began when it couldn’t build follow-through above $90,000 and $90,500. Once that upside stalled, sellers took control and pushed price down through $88,500. The slide accelerated enough to spike below $87,000, but the market didn’t free-fall. Bulls defended the $85,000 zone, printing a low at $85,151. Since then, Bitcoin has been consolidating below the 23.6% Fibonacci retracement of the drop from the $93,560 swing high to the $85,151 low — a clue that the bounce is still shallow and that sellers haven’t fully backed off yet. Structurally, BTC is still on the back foot: It’s trading below $88,000, and It remains below the 100-hour Simple Moving Average, keeping short-term trend pressure pointed downward. Resistance is layered, and $89,000 is the problem area(h3) If bulls try to turn this into a recovery, they’ll have to climb through multiple ceilings in quick succession. First, BTC faces resistance around $87,150, followed by a more meaningful barrier near $87,500. From there, the market’s attention snaps back to $88,000 — the level BTC just lost and now needs to reclaim. A close back above $88,000 would improve the tone, but it doesn’t solve the bigger issue: there’s a bearish trend line on the hourly BTC/USD chart (Kraken feed) with resistance near $89,000, which also lines up with the next technical hurdle. If BTC can push through $89,000 and hold, the rebound could extend toward $90,000, with follow-through targets at $91,000 and $91,500. But until price clears that $88,000–$89,000 zone, rallies are at risk of being sold rather than chased. If BTC fails to reclaim resistance, the downside path is clear(h3) The near-term bear case is simple: if Bitcoin can’t climb back above the $87,000 area and keep traction, sellers may attempt another leg lower. Support levels line up like this: Immediate support: $85,500 First major support: $85,000 Next support: $83,500 Then $82,500 in the near term Below that, the major “don’t break this” level is still $80,000. If BTC slips under $80,000, the risk of acceleration to the downside increases significantly — not because it’s magic, but because it’s the kind of psychological and structural level that tends to trigger forced de-risking. Indicators: momentum still leans bearish(h3) The intraday indicators aren’t offering much comfort yet: Hourly MACD is losing pace in the bearish zone. Hourly RSI remains below 50, suggesting sellers still have the upper hand on short timeframes. So while the $85,000 defense held for now, the market hasn’t flipped bullish — it’s just stopped bleeding.
goTop
quote