Gold under pressure as traders brace for delayed US NFP release

Source Fxstreet
  • Gold trades on the back foot as traders trim exposure ahead of a heavy US economic data slate.
  • Focus turns to the delayed US Nonfarm Payrolls reports for October and November, due at 13:30 GMT
  • Technically, Gold shows signs of near-term consolidation after repeated rejection near the $4,350 area, even as the broader uptrend remains intact.

Gold (XAU/USD) trades on the back foot on Tuesday as traders trim exposure ahead of a heavy US economic data docket that could reshape expectations for the Federal Reserve’s (Fed) monetary policy path into 2026. At the time of writing, XAU/USD is hovering around $4,278, giving back part of its recent gains after struggling to sustain traction near record highs.

Attention is firmly on the delayed Nonfarm Payrolls (NFP) reports for October and November, which were postponed due to the recent government shutdown and are scheduled for release at 13:30 GMT.

The Fed’s monetary policy path has continued to dominate market sentiment since last week’s 25 basis point (bps) rate cut. The central bank has delivered 75 bps of easing this year amid signs of labour market cooling, even as inflation remains above the 2% target.

The upcoming data is expected to play a key role in shaping near-term rate expectations, with weaker-than-expected readings likely to reinforce bets that policymakers could be forced to act sooner than currently anticipated.

In addition to the NFP releases, traders will also monitor the ADP Employment Change four-week average, Retail Sales, and preliminary S&P Global Purchasing Managers Index (PMI) data.

Market movers: Peace-talk optimism, US jobs data and Fed signals in focus

  • Reports of progress in US-led Russia-Ukraine peace talks have modestly eased geopolitical tensions, limiting safe-haven flows into Gold. Ukrainian officials described “real progress” from peace talks in Berlin, saying negotiations with US envoys have been constructive and productive, including discussions around strong security guarantees for Kyiv. US President Donald Trump echoed the optimism, saying a peace deal is “closer now than we have been, ever,” while senior US officials indicated Washington is prepared to offer NATO-style security guarantees as part of a negotiated framework.
  • Economists expect the November NFP report to show job gains of around 50,000, with the Unemployment Rate seen holding at 4.4%. The release will also include a partial update for October, after some labour-market data was not collected due to the government shutdown. For context, payrolls increased by 119,000 jobs in September. It is also worth noting that Fed Chair Jerome Powell warned at last week’s meeting that reported NFP gains since April may be overstated by roughly 60,000.
  • At last week’s Federal Open Market Committee (FOMC) meeting, Fed Chair Jerome Powell said the central bank is “well-positioned to wait and see how the economy evolves.” Even so, policymakers remain divided over the need for additional easing in 2026, leaving investors uncertain about the policy outlook. Markets are largely pricing in a hold in January, with nearly a 40% probability of a rate cut in March, according to the CME FedWatch Tool.
  • New York Fed President John Williams said on Monday that monetary policy is well-positioned as the US heads into 2026, noting that inflation is expected to moderate further while labour-market risks have increased. In contrast, Fed Governor Stephen Miran reiterated his dovish stance, arguing that underlying inflation pressures are lower than headline measures suggest and cautioning against keeping policy overly restrictive. Miran, who favoured a larger 50 basis point rate cut at the last meeting, said a faster pace of easing would move policy closer to the neutral rate, warning that holding policy too tight risks unnecessary job losses. He added that future dissents will depend on policy decisions and said he would like rates to decline further.
  • Markets are also closely monitoring developments around the potential Federal Reserve leadership change, with Reuters reporting that Kevin Hassett’s candidacy has faced pushback from individuals close to President Donald Trump, shifting attention toward former Fed Governor Kevin Warsh, who is increasingly seen as the leading contender to succeed Chair Jerome Powell, whose term ends in May 2026.

Technical analysis: XAU/USD eyes $4,250 support after failing near $4,350

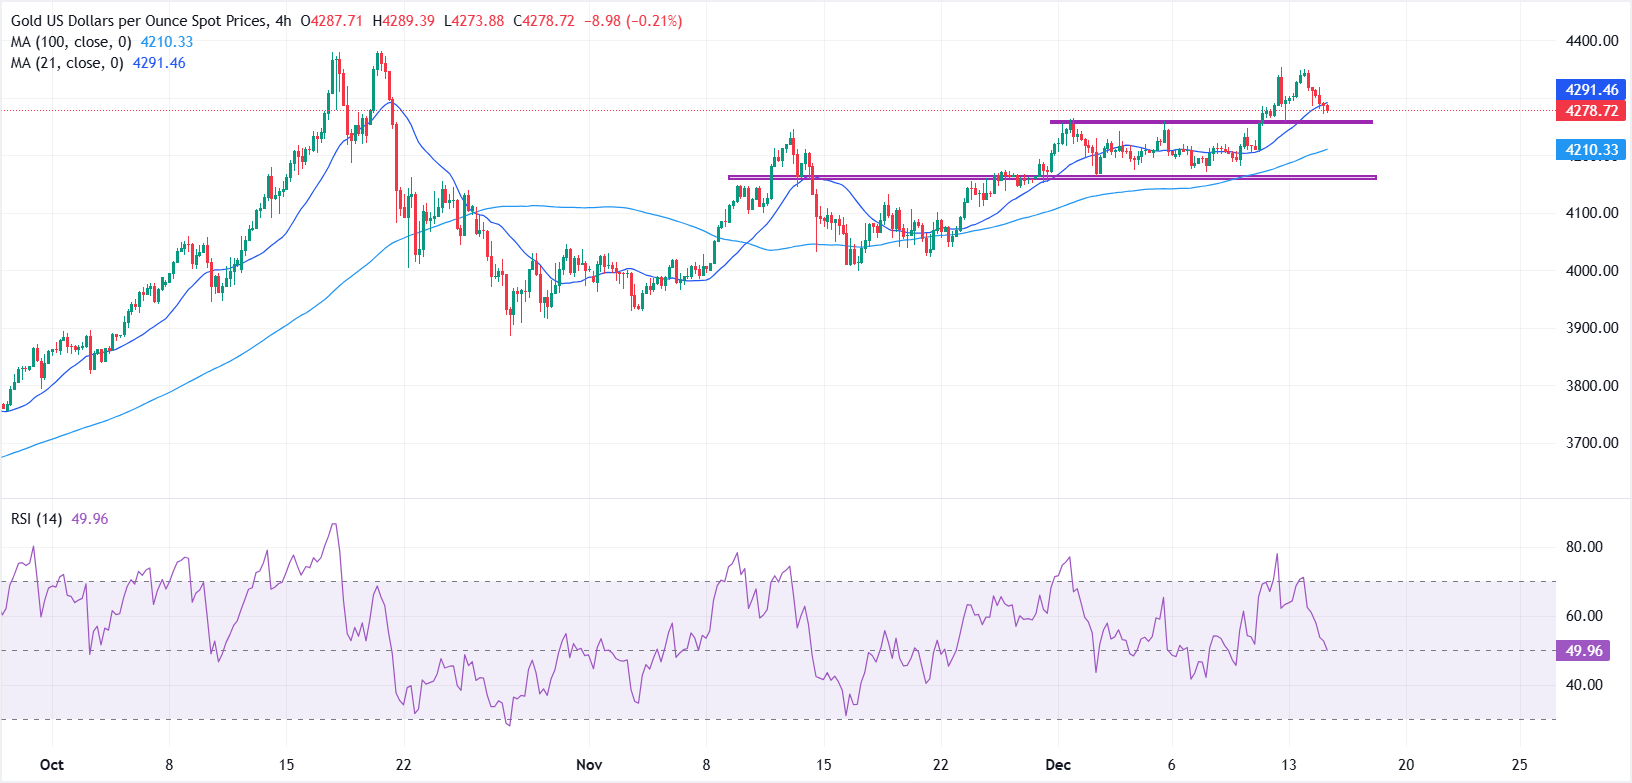
From a technical perspective, Gold’s near-term bias has turned slightly bearish to neutral after sellers once again stepped in near the $4,350 region, pushing prices lower from recent highs.

On the 4-hour chart, XAU/USD is trading below the 21-period Simple Moving Average (SMA), near $4,291, which is acting as immediate resistance and signalling that sellers retain short-term control.

A sustained move back above this level would be needed to ease downside pressure, with the next upside hurdle seen around $4,350, ahead of a potential retest of the all-time high near $4,381.

On the downside, $4,250 marks immediate support, while the 100-period SMA at $4,210.31 provides a key dynamic support zone. As long as prices hold above the rising 100-period SMA, the broader uptrend remains intact. However, a decisive break below this level would tilt the near-term structure lower.

Meanwhile, the Relative Strength Index (RSI) has slipped back toward the neutral 50 area, reflecting fading bullish momentum and reinforcing the view that Gold may remain in short-term consolidation before attempting another leg higher.

Gold FAQs

Gold has played a key role in human’s history as it has been widely used as a store of value and medium of exchange. Currently, apart from its shine and usage for jewelry, the precious metal is widely seen as a safe-haven asset, meaning that it is considered a good investment during turbulent times. Gold is also widely seen as a hedge against inflation and against depreciating currencies as it doesn’t rely on any specific issuer or government.

Central banks are the biggest Gold holders. In their aim to support their currencies in turbulent times, central banks tend to diversify their reserves and buy Gold to improve the perceived strength of the economy and the currency. High Gold reserves can be a source of trust for a country’s solvency. Central banks added 1,136 tonnes of Gold worth around $70 billion to their reserves in 2022, according to data from the World Gold Council. This is the highest yearly purchase since records began. Central banks from emerging economies such as China, India and Turkey are quickly increasing their Gold reserves.

Gold has an inverse correlation with the US Dollar and US Treasuries, which are both major reserve and safe-haven assets. When the Dollar depreciates, Gold tends to rise, enabling investors and central banks to diversify their assets in turbulent times. Gold is also inversely correlated with risk assets. A rally in the stock market tends to weaken Gold price, while sell-offs in riskier markets tend to favor the precious metal.

The price can move due to a wide range of factors. Geopolitical instability or fears of a deep recession can quickly make Gold price escalate due to its safe-haven status. As a yield-less asset, Gold tends to rise with lower interest rates, while higher cost of money usually weighs down on the yellow metal. Still, most moves depend on how the US Dollar (USD) behaves as the asset is priced in dollars (XAU/USD). A strong Dollar tends to keep the price of Gold controlled, whereas a weaker Dollar is likely to push Gold prices up.

Disclaimer: For information purposes only. Past performance is not indicative of future results.
placeholder
Gold Price Forecast: XAU/USD drifts higher above $4,200 as Fed delivers expected cutGold price (XAU/USD) gains momentum to around $4,235 during the early Asian session on Thursday. The precious metal extends its upside after the US Federal Reserve (Fed) delivered an expected third consecutive interest rate cut and maintained its outlook for just one cut in 2026.
Author  FXStreet
Dec 11, Thu
Gold price (XAU/USD) gains momentum to around $4,235 during the early Asian session on Thursday. The precious metal extends its upside after the US Federal Reserve (Fed) delivered an expected third consecutive interest rate cut and maintained its outlook for just one cut in 2026.
placeholder
Gold remains bid as lack of Fed clarity and geopolitical frictions persistGold (XAU/USD) advances modestly on Friday as traders seem to book profits ahead of the weekend, yet clings to gains of over 0.51% after reaching a seven-week high of $4,353. At the time of writing, XAU/USD trades at $4,302 as traders digest comments from Federal Reserve (Fed) officials.
Author  FXStreet
Yesterday 01: 34
Gold (XAU/USD) advances modestly on Friday as traders seem to book profits ahead of the weekend, yet clings to gains of over 0.51% after reaching a seven-week high of $4,353. At the time of writing, XAU/USD trades at $4,302 as traders digest comments from Federal Reserve (Fed) officials.
placeholder
Ethereum Price Slips Lower — $3,000 Looms as the Key BattlegroundEthereum is attempting to recover from a $3,026 low but remains below $3,200 and the 100-hour SMA, with a bearish trend line near $3,175 capping rebounds as bulls need a clean break above $3,200 to target $3,250–$3,400, while a drop below $3,050 risks a retest of $3,000 and $2,940.
Author  Mitrade
Yesterday 03: 25
Ethereum is attempting to recover from a $3,026 low but remains below $3,200 and the 100-hour SMA, with a bearish trend line near $3,175 capping rebounds as bulls need a clean break above $3,200 to target $3,250–$3,400, while a drop below $3,050 risks a retest of $3,000 and $2,940.
placeholder
Macro Analysts: Hawkish Japan Could Push Bitcoin Below $70KAnalysts predict Bitcoin may face further declines towards the $70,000 mark if the Bank of Japan raises interest rates as expected.
Author  Mitrade
Yesterday 05: 48
Analysts predict Bitcoin may face further declines towards the $70,000 mark if the Bank of Japan raises interest rates as expected.
placeholder
Bitcoin Slides 5% as Sellers Lean In — Can BTC Reclaim $88,000?Bitcoin has dropped back below $88,000 after rolling over from $90,500, with price still trading under the 100-hour Simple Moving Average. The sell-off found a floor at $85,151, and BTC is now consolidating near that base, but rebounds are facing pressure from a bearish trend line around $89,000. Bulls need to retake $88,000–$89,000 to ease downside risk; failure to do so keeps $85,500–$85,000 and then $83,500 in play, with $80,000 as the deeper “line in the sand.” Bitcoin (BTC) is back in damage-control mode after a sharp pullback wiped out recent gains. The price failed to reclaim the $90,000–$90,500 band, rolled over, and slid through $88,500 before briefly dipping under $87,000. Buyers did show up around $85,000, but the rebound so far looks more like stabilization than a clear trend reversal. Bitcoin dips hard, finds a bid near $85,000(h3) BTC’s latest move lower began when it couldn’t build follow-through above $90,000 and $90,500. Once that upside stalled, sellers took control and pushed price down through $88,500. The slide accelerated enough to spike below $87,000, but the market didn’t free-fall. Bulls defended the $85,000 zone, printing a low at $85,151. Since then, Bitcoin has been consolidating below the 23.6% Fibonacci retracement of the drop from the $93,560 swing high to the $85,151 low — a clue that the bounce is still shallow and that sellers haven’t fully backed off yet. Structurally, BTC is still on the back foot: It’s trading below $88,000, and It remains below the 100-hour Simple Moving Average, keeping short-term trend pressure pointed downward. Resistance is layered, and $89,000 is the problem area(h3) If bulls try to turn this into a recovery, they’ll have to climb through multiple ceilings in quick succession. First, BTC faces resistance around $87,150, followed by a more meaningful barrier near $87,500. From there, the market’s attention snaps back to $88,000 — the level BTC just lost and now needs to reclaim. A close back above $88,000 would improve the tone, but it doesn’t solve the bigger issue: there’s a bearish trend line on the hourly BTC/USD chart (Kraken feed) with resistance near $89,000, which also lines up with the next technical hurdle. If BTC can push through $89,000 and hold, the rebound could extend toward $90,000, with follow-through targets at $91,000 and $91,500. But until price clears that $88,000–$89,000 zone, rallies are at risk of being sold rather than chased. If BTC fails to reclaim resistance, the downside path is clear(h3) The near-term bear case is simple: if Bitcoin can’t climb back above the $87,000 area and keep traction, sellers may attempt another leg lower. Support levels line up like this: Immediate support: $85,500 First major support: $85,000 Next support: $83,500 Then $82,500 in the near term Below that, the major “don’t break this” level is still $80,000. If BTC slips under $80,000, the risk of acceleration to the downside increases significantly — not because it’s magic, but because it’s the kind of psychological and structural level that tends to trigger forced de-risking. Indicators: momentum still leans bearish(h3) The intraday indicators aren’t offering much comfort yet: Hourly MACD is losing pace in the bearish zone. Hourly RSI remains below 50, suggesting sellers still have the upper hand on short timeframes. So while the $85,000 defense held for now, the market hasn’t flipped bullish — it’s just stopped bleeding.
Author  Mitrade
11 hours ago
Bitcoin has dropped back below $88,000 after rolling over from $90,500, with price still trading under the 100-hour Simple Moving Average. The sell-off found a floor at $85,151, and BTC is now consolidating near that base, but rebounds are facing pressure from a bearish trend line around $89,000. Bulls need to retake $88,000–$89,000 to ease downside risk; failure to do so keeps $85,500–$85,000 and then $83,500 in play, with $80,000 as the deeper “line in the sand.” Bitcoin (BTC) is back in damage-control mode after a sharp pullback wiped out recent gains. The price failed to reclaim the $90,000–$90,500 band, rolled over, and slid through $88,500 before briefly dipping under $87,000. Buyers did show up around $85,000, but the rebound so far looks more like stabilization than a clear trend reversal. Bitcoin dips hard, finds a bid near $85,000(h3) BTC’s latest move lower began when it couldn’t build follow-through above $90,000 and $90,500. Once that upside stalled, sellers took control and pushed price down through $88,500. The slide accelerated enough to spike below $87,000, but the market didn’t free-fall. Bulls defended the $85,000 zone, printing a low at $85,151. Since then, Bitcoin has been consolidating below the 23.6% Fibonacci retracement of the drop from the $93,560 swing high to the $85,151 low — a clue that the bounce is still shallow and that sellers haven’t fully backed off yet. Structurally, BTC is still on the back foot: It’s trading below $88,000, and It remains below the 100-hour Simple Moving Average, keeping short-term trend pressure pointed downward. Resistance is layered, and $89,000 is the problem area(h3) If bulls try to turn this into a recovery, they’ll have to climb through multiple ceilings in quick succession. First, BTC faces resistance around $87,150, followed by a more meaningful barrier near $87,500. From there, the market’s attention snaps back to $88,000 — the level BTC just lost and now needs to reclaim. A close back above $88,000 would improve the tone, but it doesn’t solve the bigger issue: there’s a bearish trend line on the hourly BTC/USD chart (Kraken feed) with resistance near $89,000, which also lines up with the next technical hurdle. If BTC can push through $89,000 and hold, the rebound could extend toward $90,000, with follow-through targets at $91,000 and $91,500. But until price clears that $88,000–$89,000 zone, rallies are at risk of being sold rather than chased. If BTC fails to reclaim resistance, the downside path is clear(h3) The near-term bear case is simple: if Bitcoin can’t climb back above the $87,000 area and keep traction, sellers may attempt another leg lower. Support levels line up like this: Immediate support: $85,500 First major support: $85,000 Next support: $83,500 Then $82,500 in the near term Below that, the major “don’t break this” level is still $80,000. If BTC slips under $80,000, the risk of acceleration to the downside increases significantly — not because it’s magic, but because it’s the kind of psychological and structural level that tends to trigger forced de-risking. Indicators: momentum still leans bearish(h3) The intraday indicators aren’t offering much comfort yet: Hourly MACD is losing pace in the bearish zone. Hourly RSI remains below 50, suggesting sellers still have the upper hand on short timeframes. So while the $85,000 defense held for now, the market hasn’t flipped bullish — it’s just stopped bleeding.
goTop
quote