Crypto Today: Bitcoin, Ethereum, XRP sell-off extends as extreme fear grips crypto market 

Source Fxstreet
  • Bitcoin declines for the fifth consecutive day amid ETF outflows and sticky bearish sentiment.
  • Ethereum falls below $3,000, undermined by bearish technical indicators and diminishing institutional interest.
  • XRP fails to recover despite total ETF inflows hitting $1 billion milestone.

Bitcoin (BTC), Ethereum (ETH) and Ripple (XRP) are trading under pressure on Tuesday as bearish sentiment in the broader cryptocurrency market lingers.

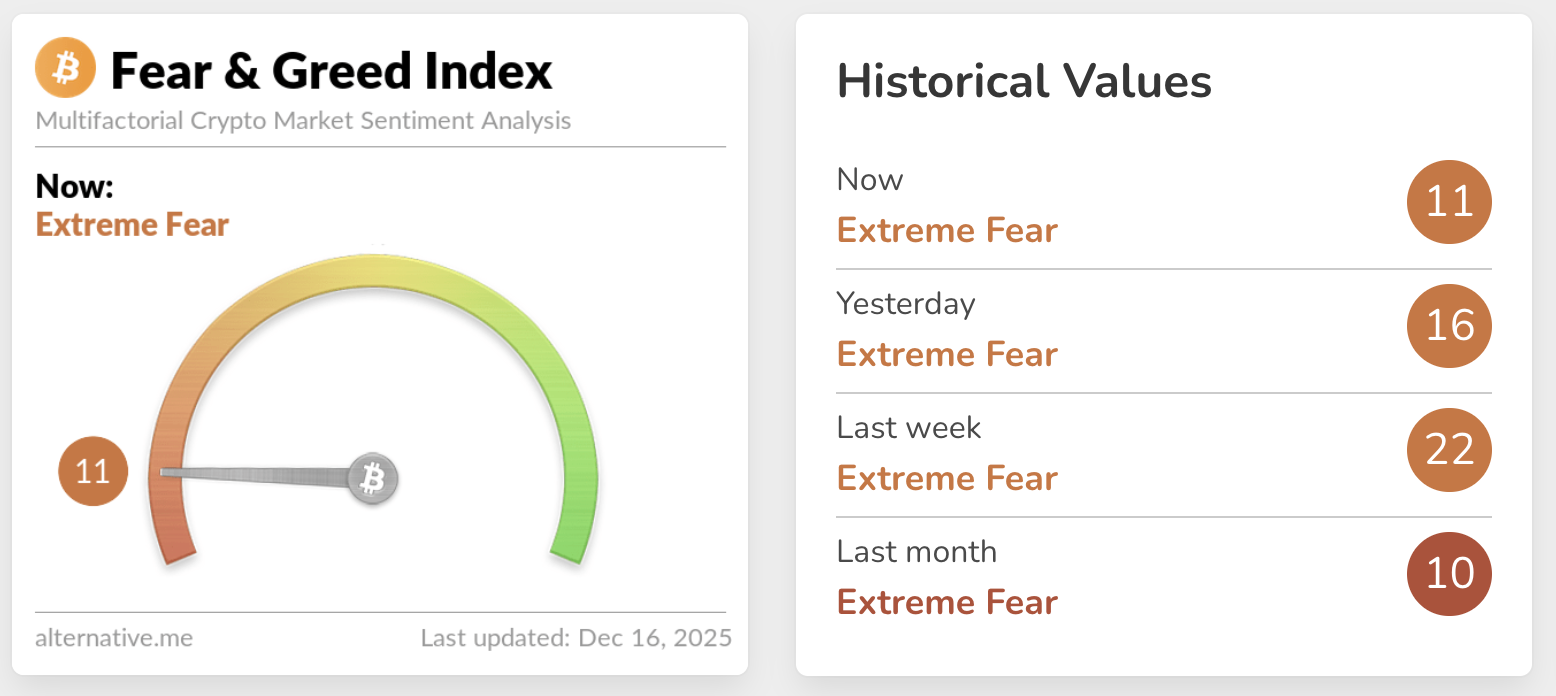
Despite Bitcoin trading above $86,000, up from an intraday low of $85,266, the overall outlook remains bearish, characterised by "extreme fear", according to the Crypto Fear & Greed Index.

Ethereum is trading above $2,900, but its upside is capped below $3,000, while XRP is engulfed in selling pressure below $2.00. 

The broader crypto market has faced extreme fear since last week, as shown in the image below. These conditions suggest that bearish sentiment is dominant and investors are likely realizing losses. However, extreme fear conditions can often precede quick rebounds, highlighting the potential for new market opportunities.

Crypto Fear & Greed Index | Source: Alternative.me

Data spotlight: BTC, ETH ETFs post outflows as XRP inflows hit $1 billion 

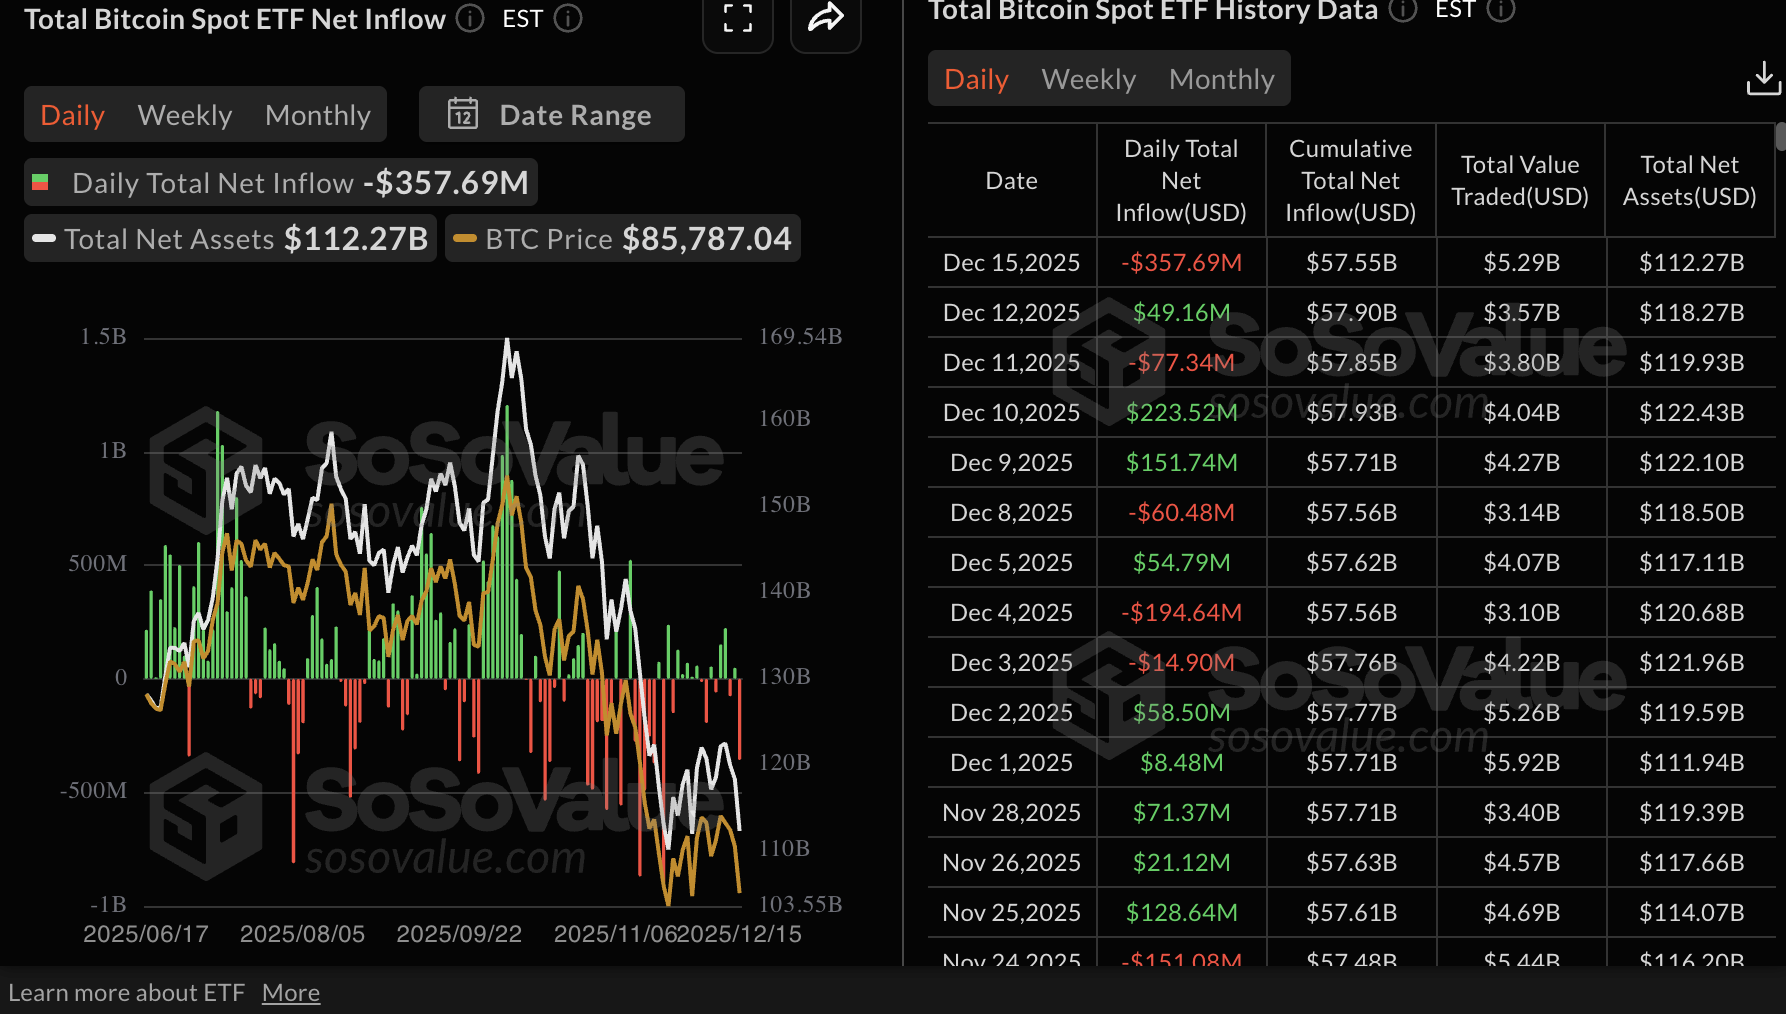
Bitcoin Exchange Traded Funds (ETFs) recorded nearly $358 million in outflows on Monday amid persistent risk-off sentiment among institutional investors.

Fidelity’s FBTC posted the largest outflow of $230 million, followed by Bitwise’s BITB with approximately $44 million and 21Shares’ ARKB with $34.5 million. The cumulative net inflow volume currently stands at $57.55 billion, and net assets are at $112.27 billion.

Bitcoin ETFs stats | Source: SoSoValue 

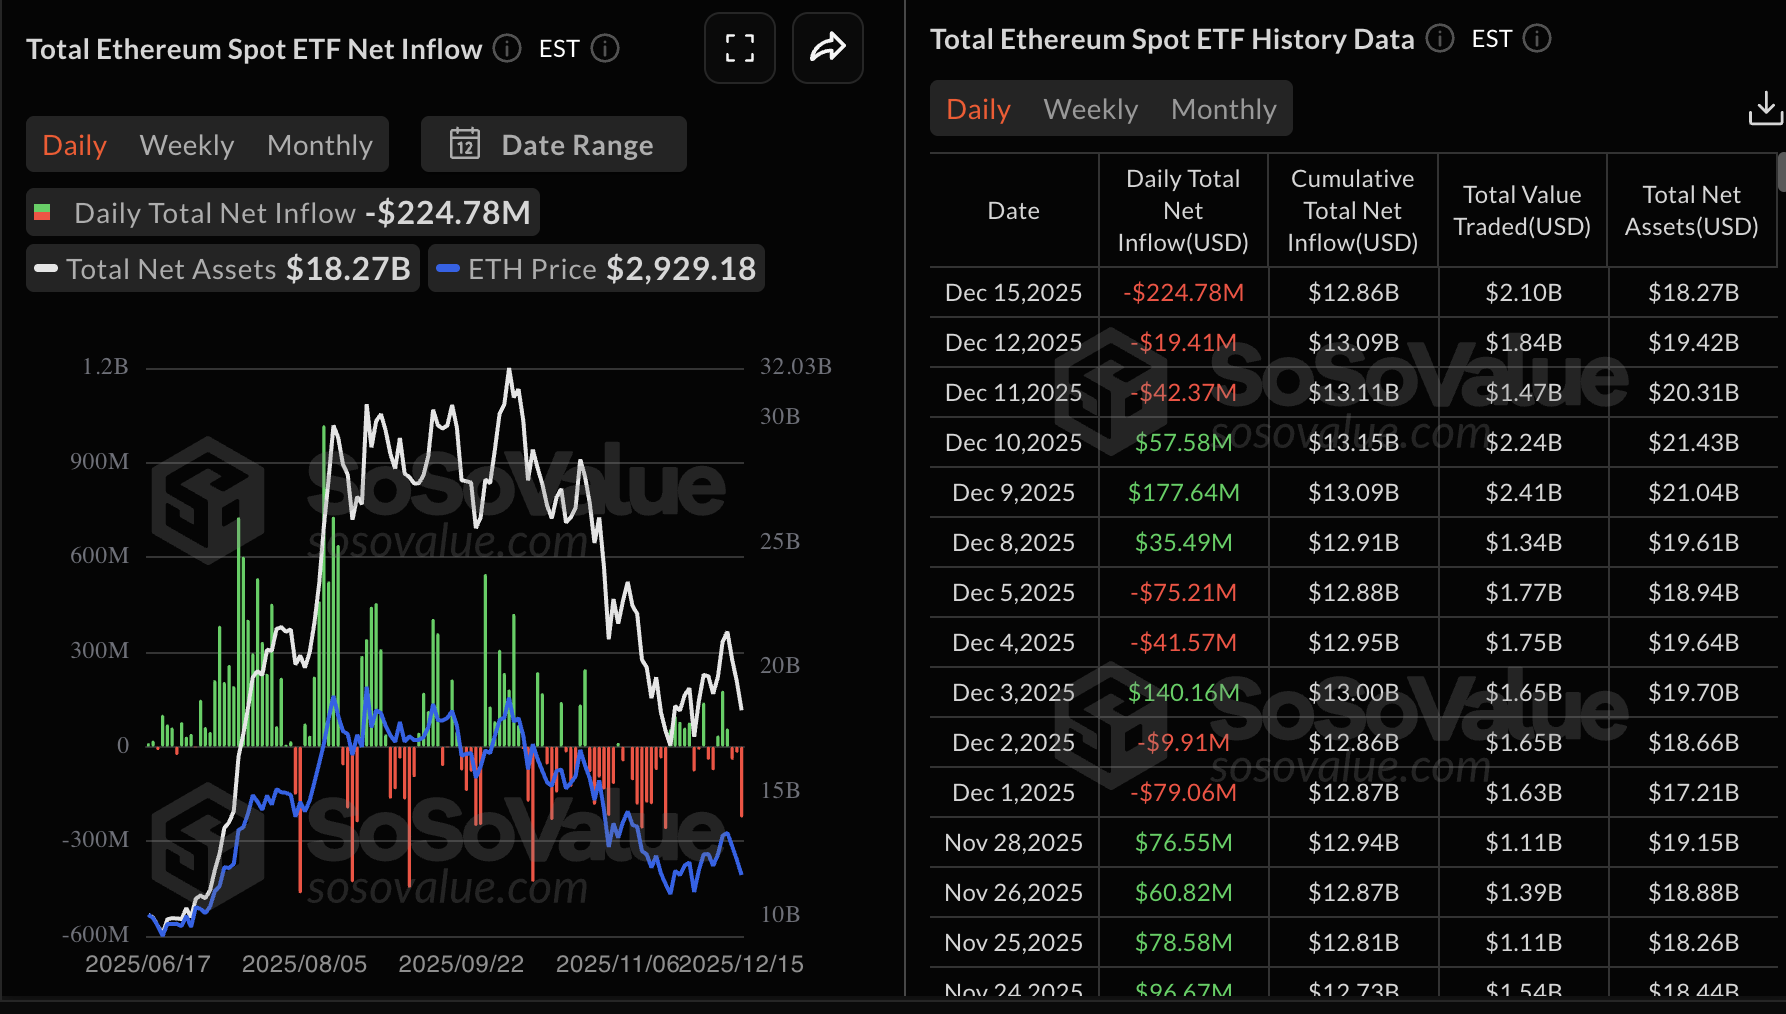
Ethereum ETFs extended their outflow streak for the third consecutive day, with nearly $225 million withdrawn on Monday. SoSoValue data shows cumulative inflow volume at $12.86 billion and net assets of $18.27 billion. BlackRock’s ETHA ETF posted the largest outflows of $139 million, followed by Grayscale’s ETHE with $35 million.

Ethereum ETFs stats | Source: SoSoValue

XRP ETFs, unlike Bitcoin and Ethereum, extended their inflow streak to 21 consecutive days, with almost $11 million deposited on Monday. The cumulative inflow volume has exceeded $1 billion, boosting net assets to $1.12 billion. This steady uptake of XRP ETFs highlights growing interest in altcoin-based crypto investment products.

XRP ETFs stats | Source: SoSoValue

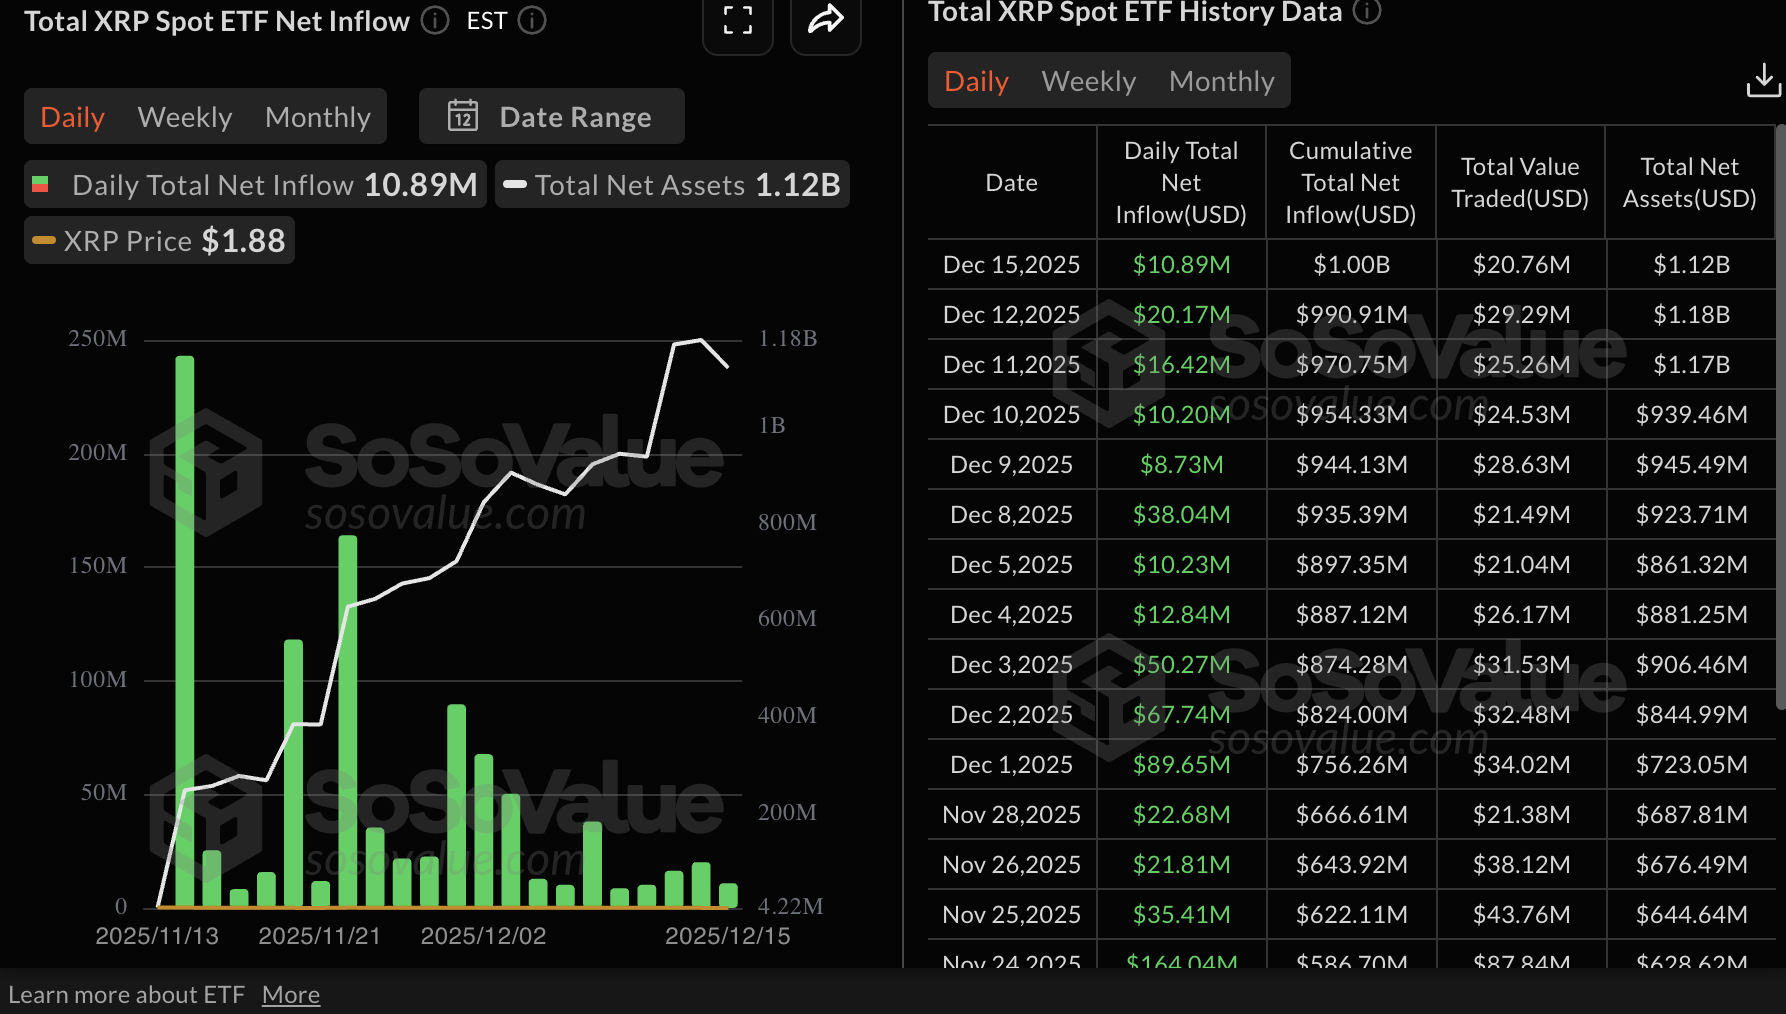
Chart of the day: Bitcoin bears tighten grip as headwinds intensify 

Bitcoin is trading above $86,000 at the time of writing on Tuesday, undermined by increasing sell-side pressure. The downtrending 50-day Exponential Moving Average (EMA) at $95,111, the 100-day EMA at $100,667 and the 200-day EMA at $102,850 support the bearish outlook.

The Relative Strength Index (RSI) on the daily chart has declined to 36, which signals increasing bearish momentum. If the Moving Average Convergence Divergence (MACD) indicator on the same chart confirms a sell signal with the blue line crossing below the red signal line, the downtrend will likely extend to test support at $80,000.

BTC/USDT daily chart 

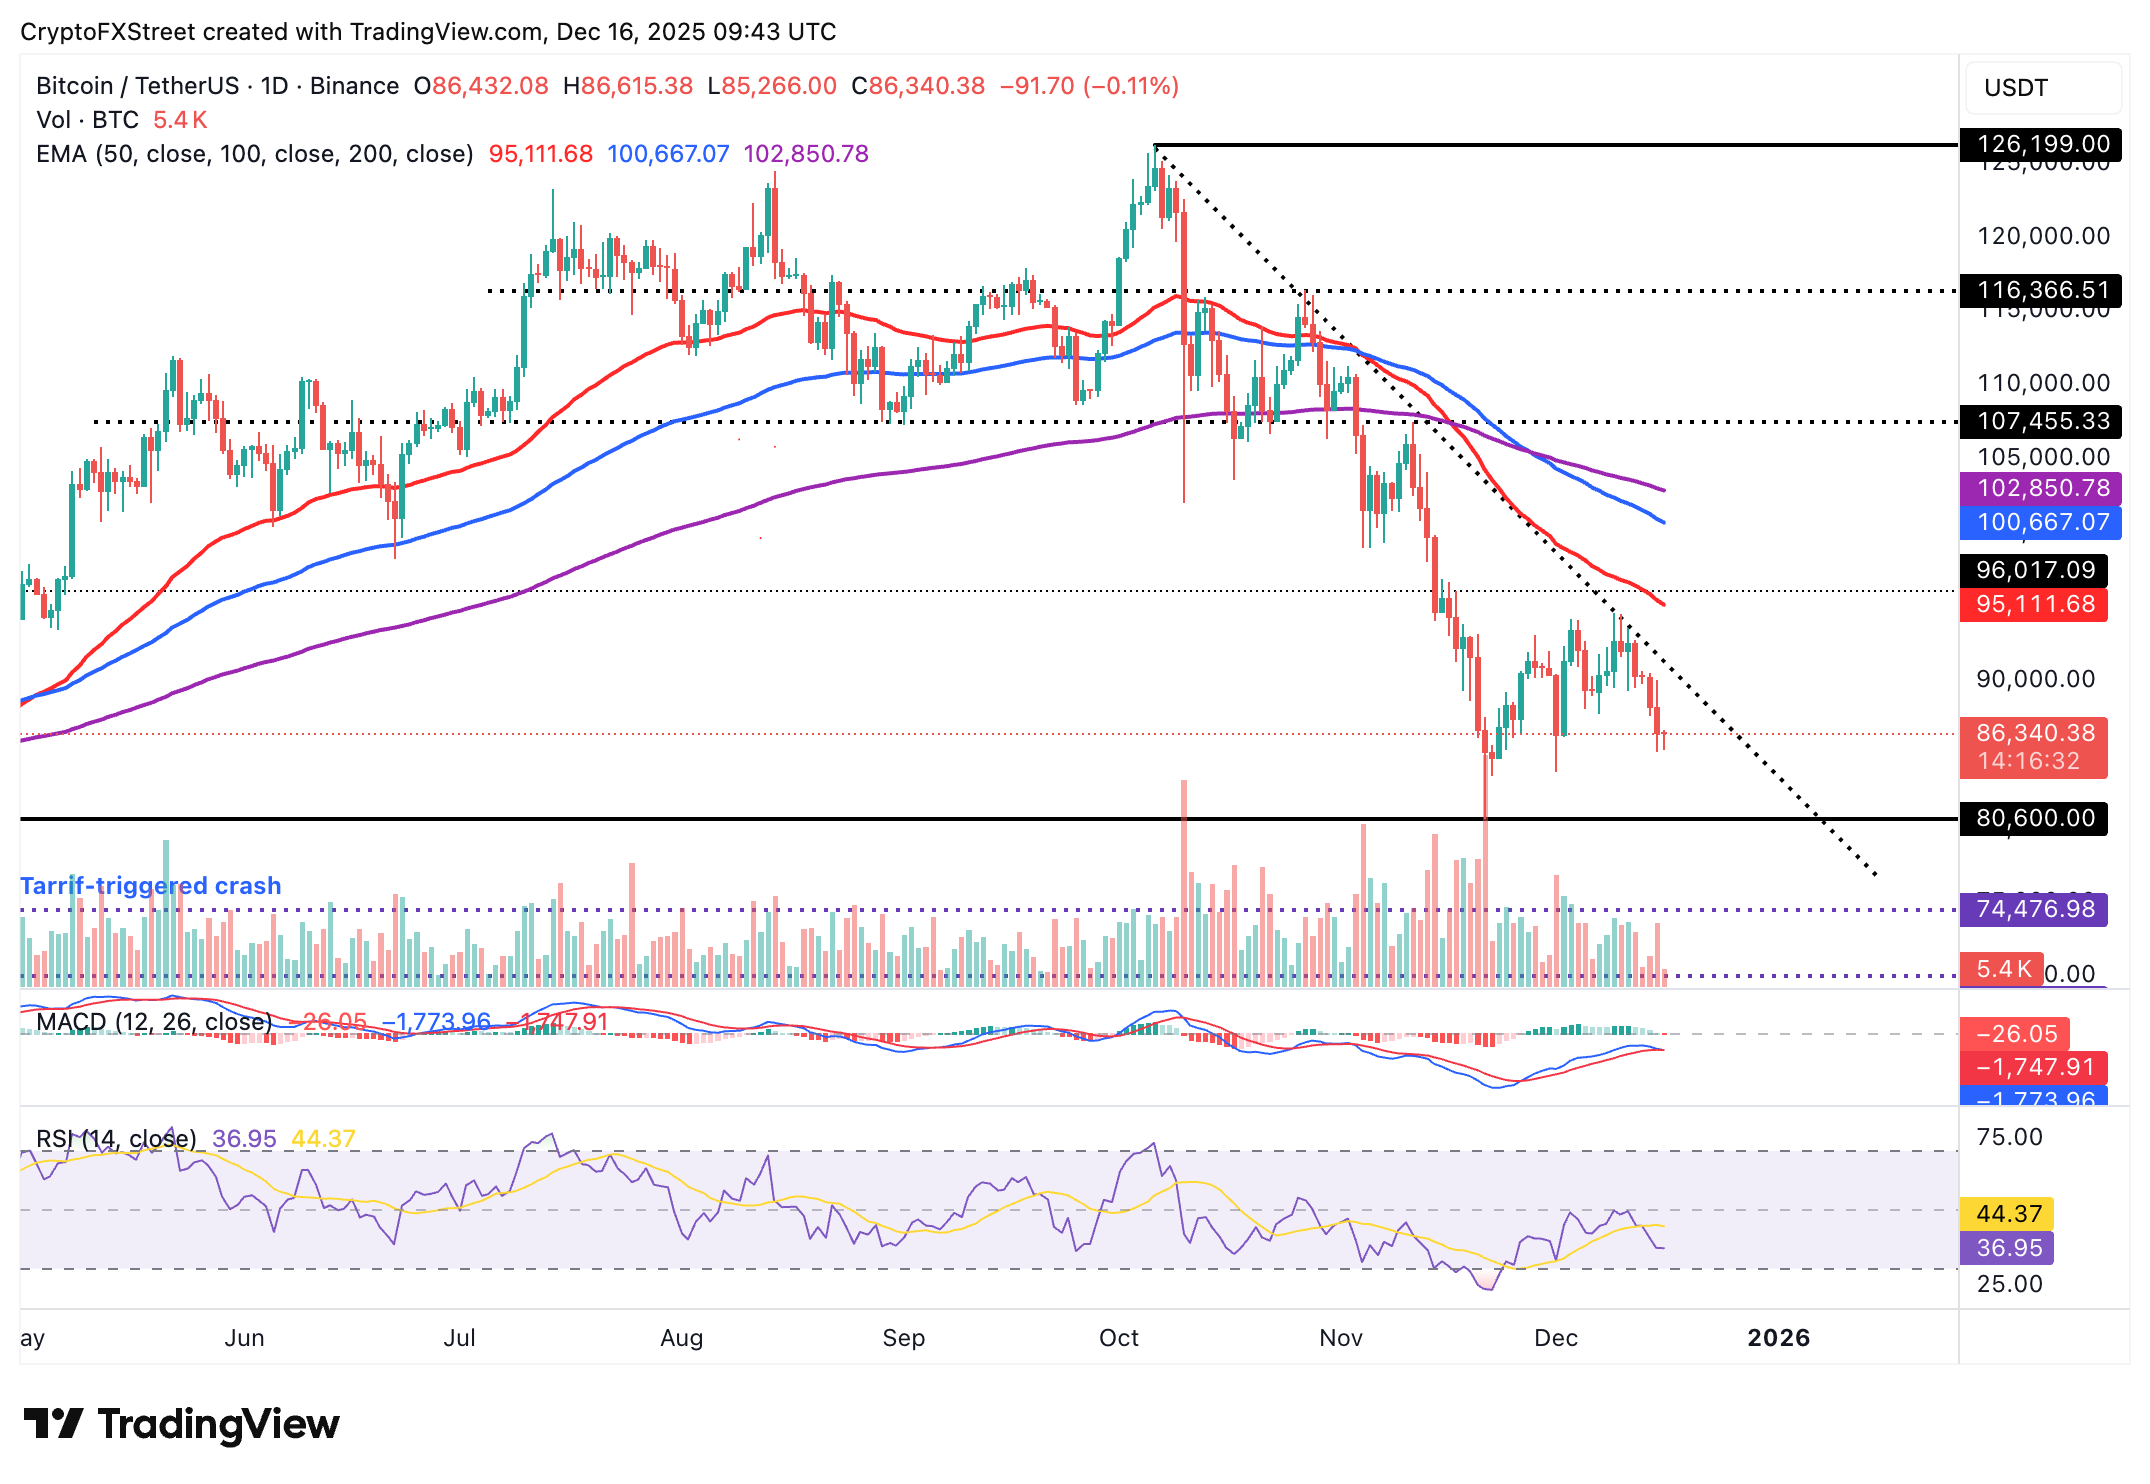
Traders should temper their bullish expectations until Bitcoin’s price rises above the descending trendline resistance and flips the 50-day EMA at $95,112 into support.

Altcoins update: Ethereum, XRP sellers in control

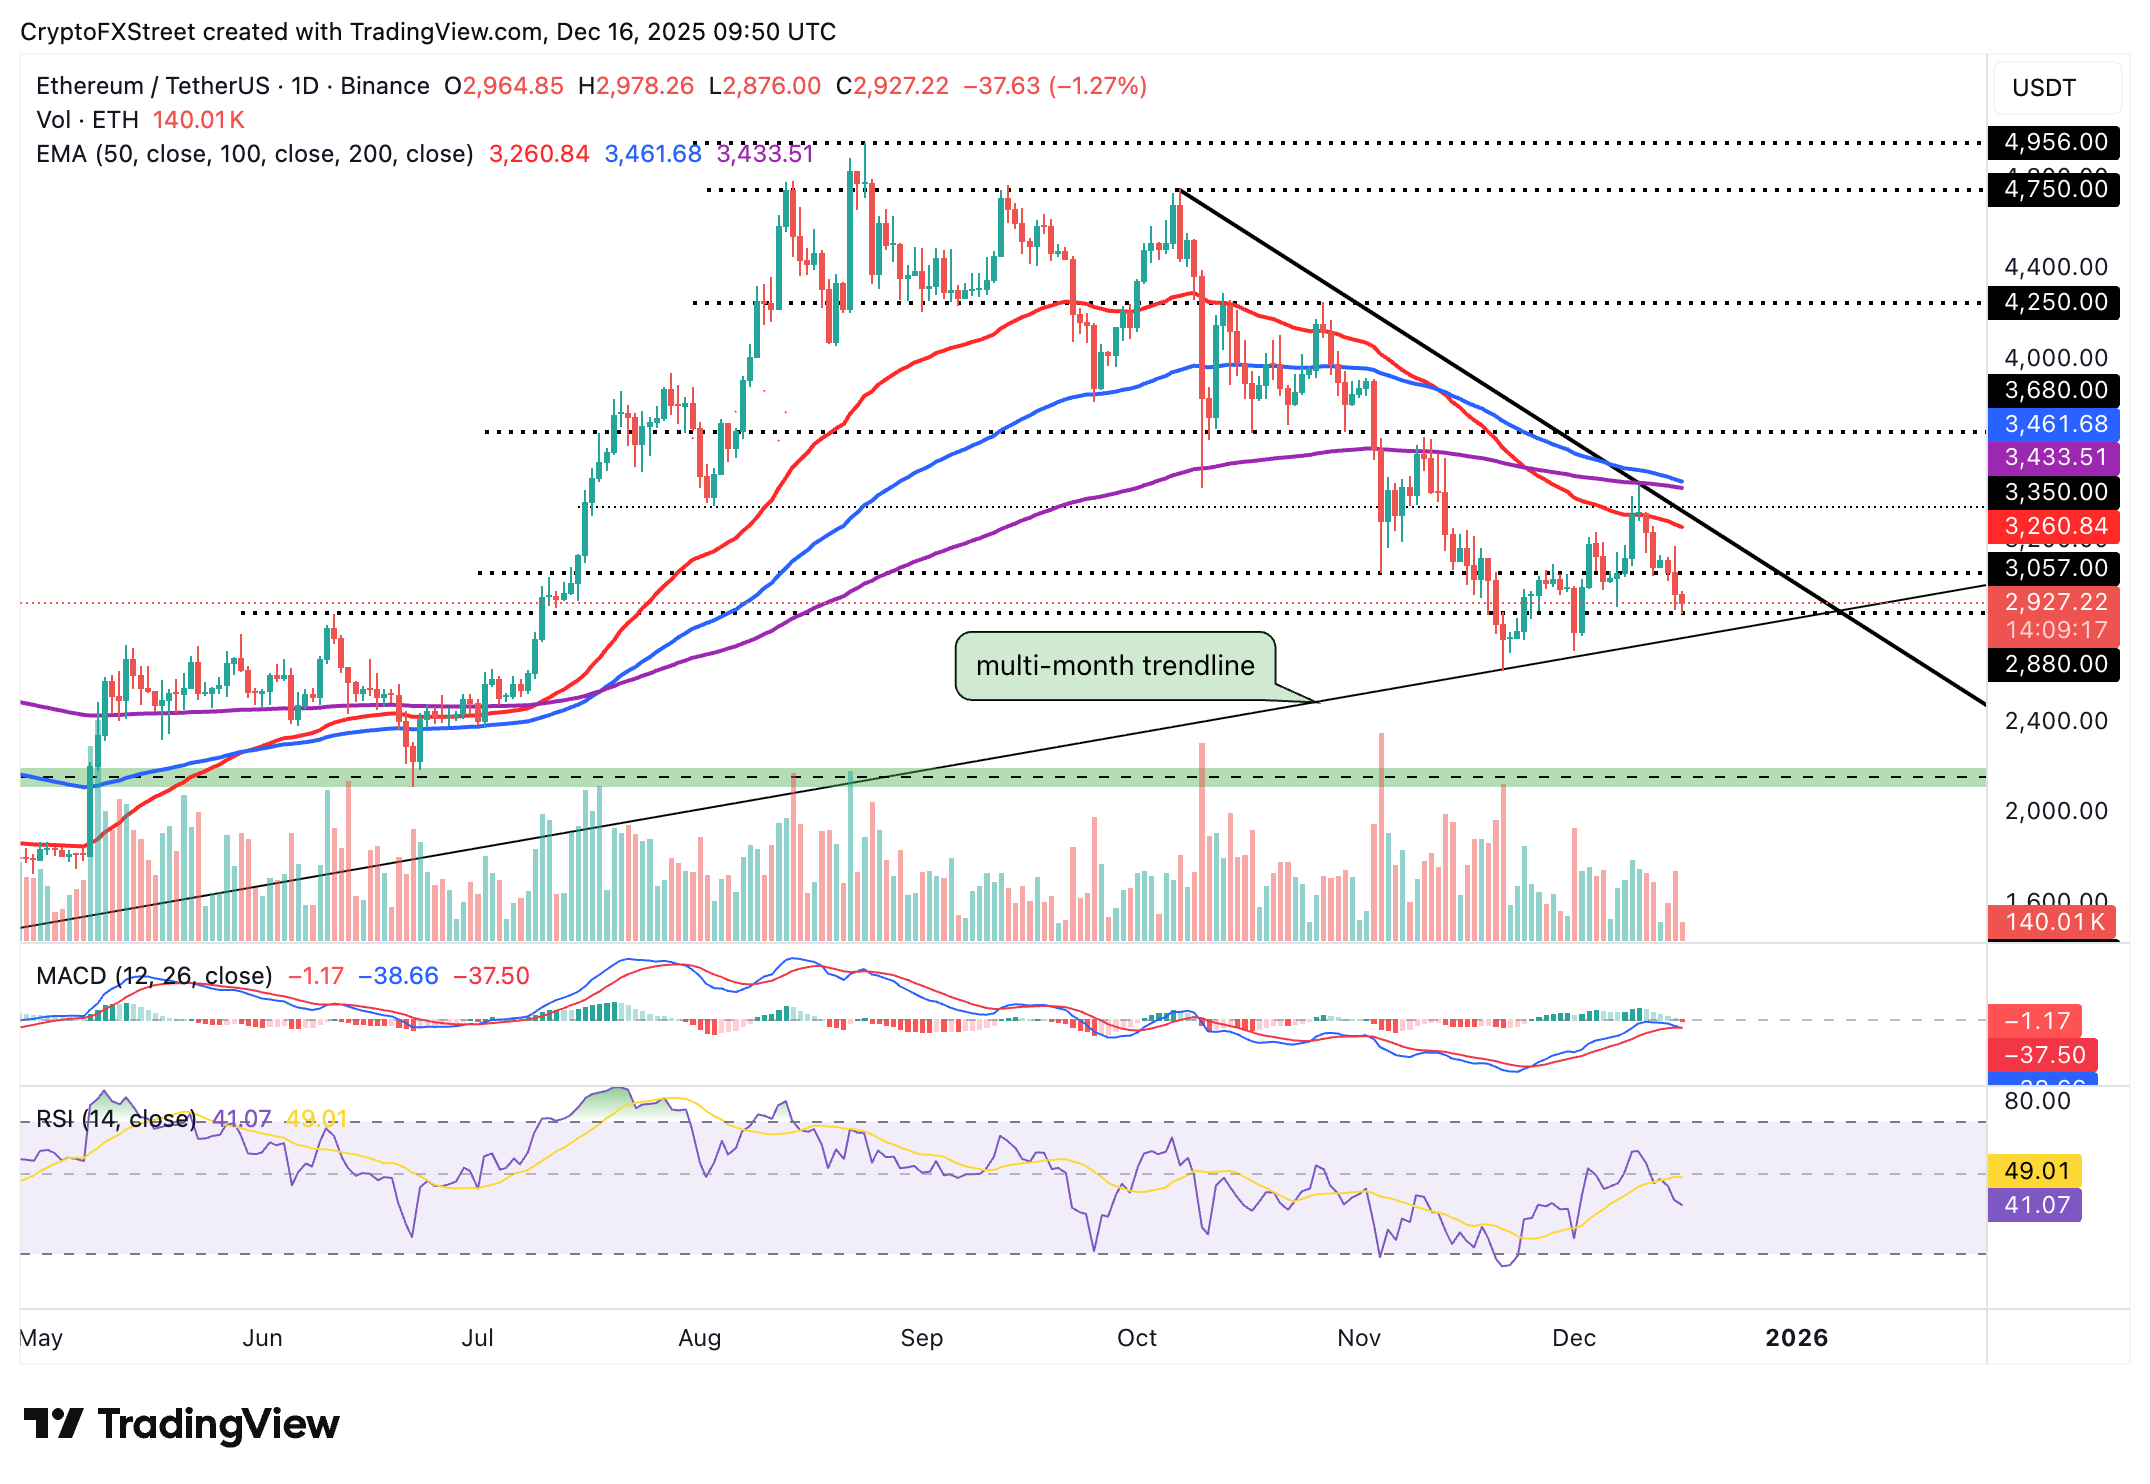
Ethereum (ETH) is trading above $2,900 at the time of writing on Tuesday, as bulls fight to uphold the short-term support at $2,880. However, sellers remain largely in control, as evidenced by the RSI on the daily chart dropping to 41, within the bearish region. 

The MACD indicator on the same chart is poised to confirm a sell signal if the blue line crosses and settles below the red signal line. Investors may be prompted to reduce their risk exposure if the red histogram bars continue to expand below the mean line.

If ETH's price rises above $3,000, that could help refocus the trend back to the upside. However, the overall outlook may remain bearish until Ethereum rises above the 50-day EMA at $3,261 and the descending trendline.

ETH/USDT daily chart

As for XRP, the token is extending the decline for the third consecutive day, hovering at $1.88 at the time of writing on Tuesday. The downward-trending 50-day EMA at $2.19, the 100-day EMA at $2.36 and the 200-day EMA at $2.44 suggest that bears may stay in control in the short term. 

XRP/USDT daily chart 

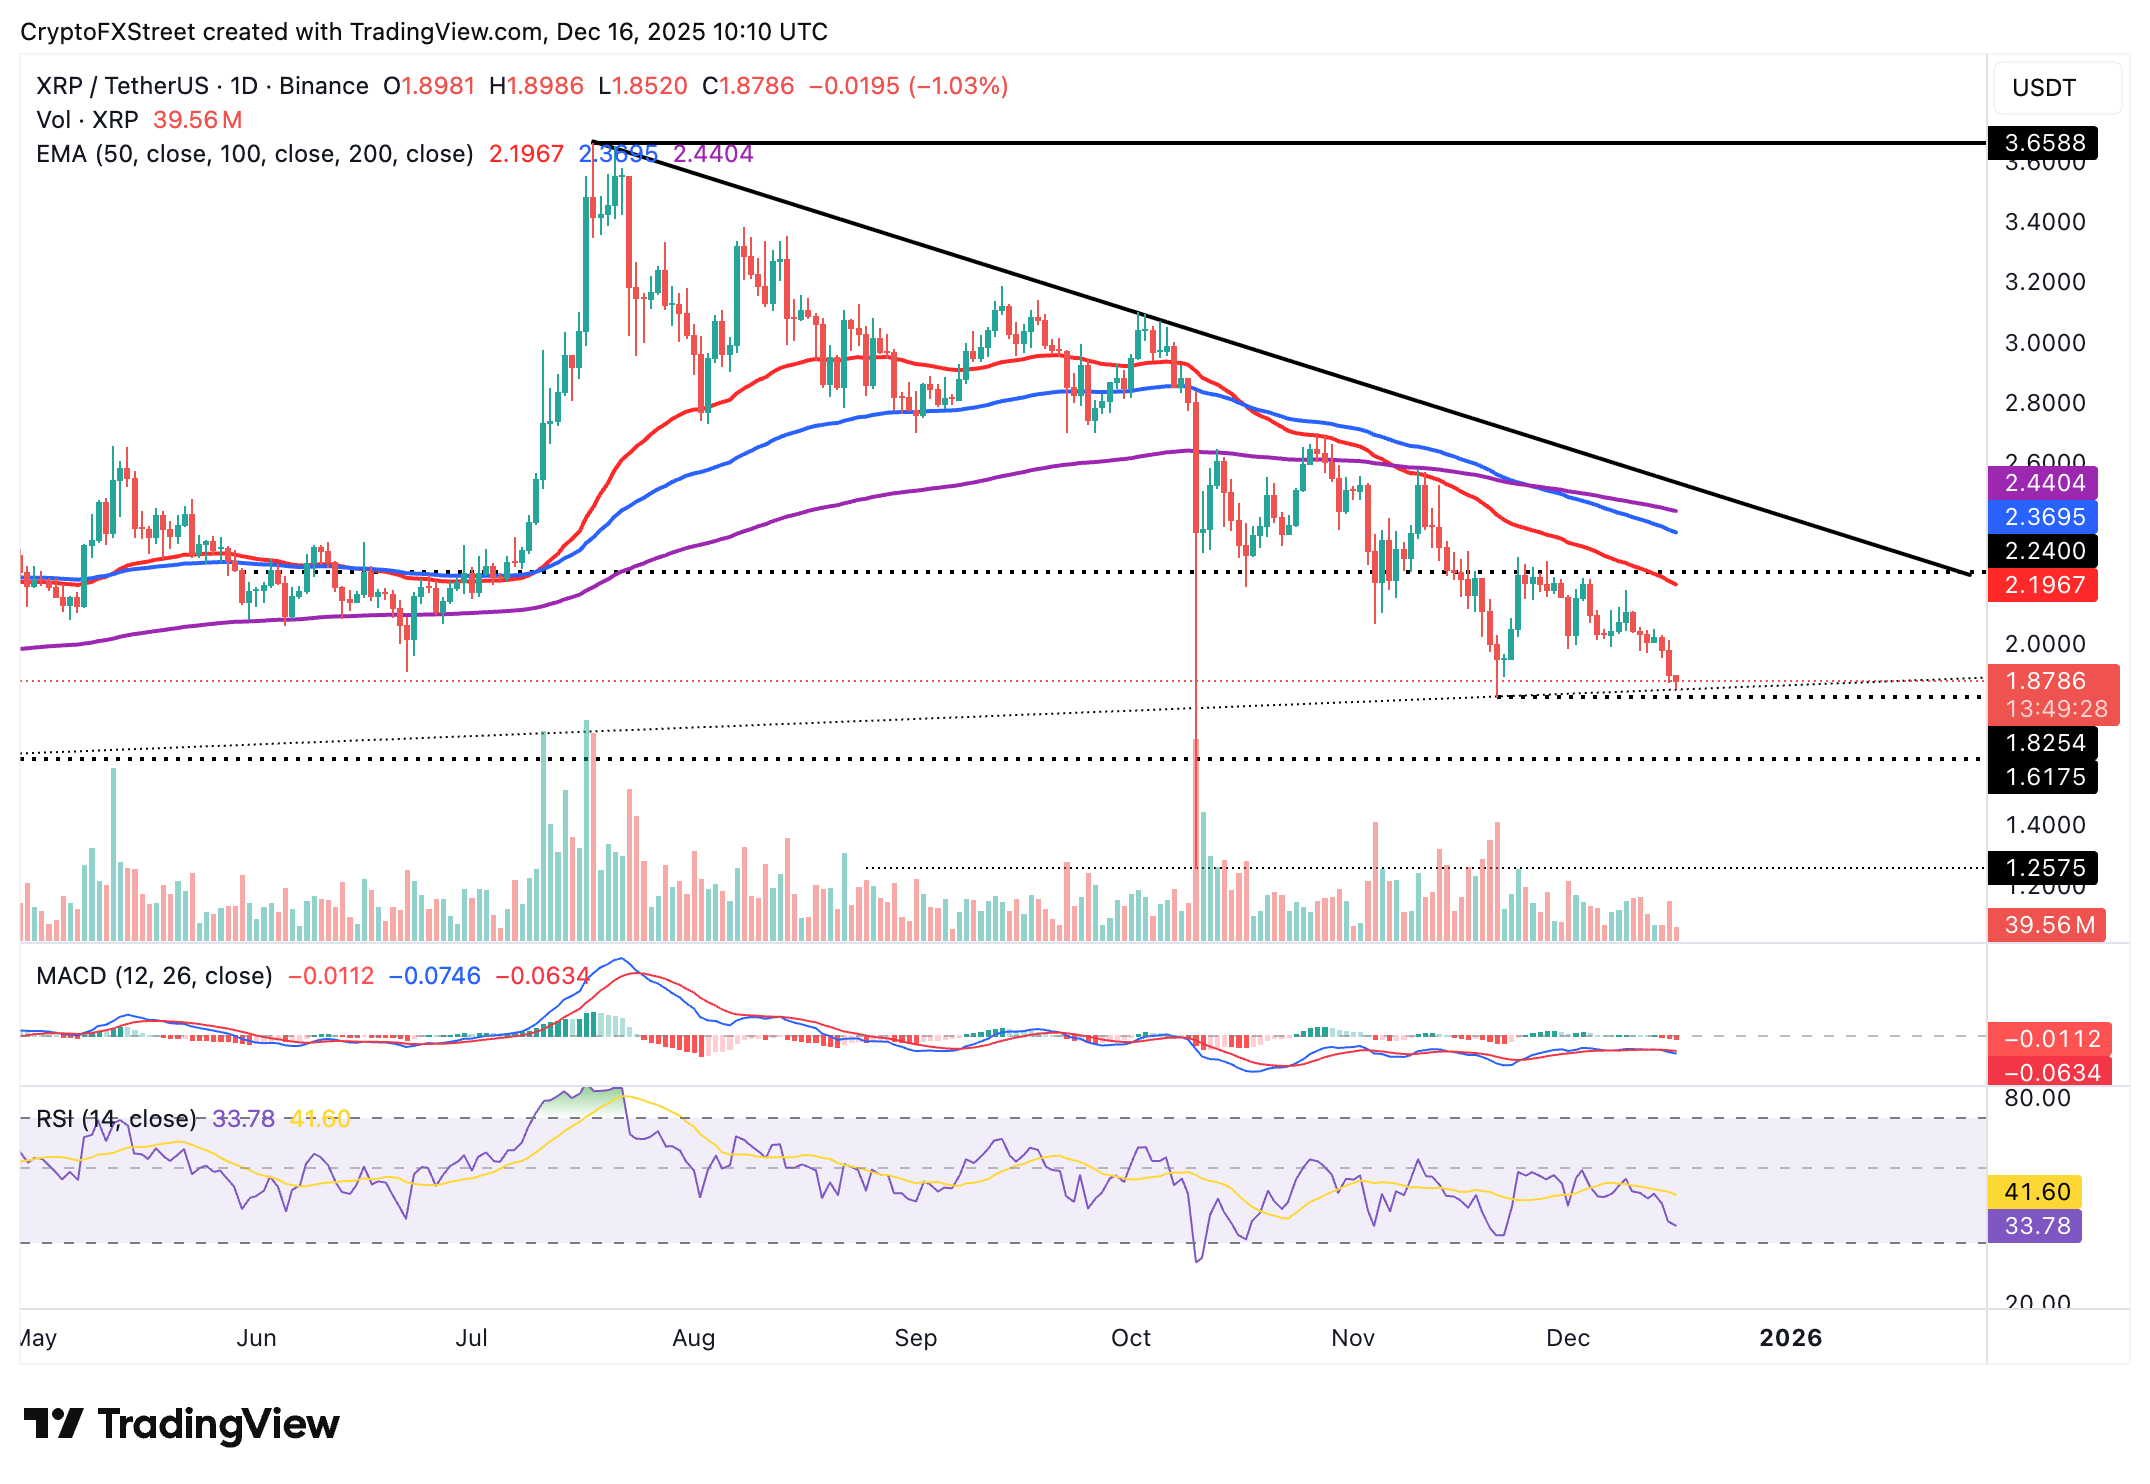
The MACD indicator has confirmed a sell signal on the daily chart, with the blue line currently below the red signal line. The RSI on the same chart is at 33 and approaching oversold territory, which emphasises the bearish outlook. 

A break below the short-term support at $1.82 (November 21 low) could accelerate the decline to April’s low of $1.61. For bulls to flip the trend strongly upward, they will have to breach the 50-day EMA hurdle at $2.19 and break above the descending trendline resistance.

Crypto ETF FAQs

An Exchange-Traded Fund (ETF) is an investment vehicle or an index that tracks the price of an underlying asset. ETFs can not only track a single asset, but a group of assets and sectors. For example, a Bitcoin ETF tracks Bitcoin’s price. ETF is a tool used by investors to gain exposure to a certain asset.

Yes. The first Bitcoin futures ETF in the US was approved by the US Securities & Exchange Commission in October 2021. A total of seven Bitcoin futures ETFs have been approved, with more than 20 still waiting for the regulator’s permission. The SEC says that the cryptocurrency industry is new and subject to manipulation, which is why it has been delaying crypto-related futures ETFs for the last few years.

Yes. The SEC approved in January 2024 the listing and trading of several Bitcoin spot Exchange-Traded Funds, opening the door to institutional capital and mainstream investors to trade the main crypto currency. The decision was hailed by the industry as a game changer.

The main advantage of crypto ETFs is the possibility of gaining exposure to a cryptocurrency without ownership, reducing the risk and cost of holding the asset. Other pros are a lower learning curve and higher security for investors since ETFs take charge of securing the underlying asset holdings. As for the main drawbacks, the main one is that as an investor you can’t have direct ownership of the asset, or, as they say in crypto, “not your keys, not your coins.” Other disadvantages are higher costs associated with holding crypto since ETFs charge fees for active management. Finally, even though investing in ETFs reduces the risk of holding an asset, price swings in the underlying cryptocurrency are likely to be reflected in the investment vehicle too.

Disclaimer: For information purposes only. Past performance is not indicative of future results.
placeholder
Gold Price Forecast: XAU/USD drifts higher above $4,200 as Fed delivers expected cutGold price (XAU/USD) gains momentum to around $4,235 during the early Asian session on Thursday. The precious metal extends its upside after the US Federal Reserve (Fed) delivered an expected third consecutive interest rate cut and maintained its outlook for just one cut in 2026.
Author  FXStreet
Dec 11, Thu
Gold price (XAU/USD) gains momentum to around $4,235 during the early Asian session on Thursday. The precious metal extends its upside after the US Federal Reserve (Fed) delivered an expected third consecutive interest rate cut and maintained its outlook for just one cut in 2026.
placeholder
Gold remains bid as lack of Fed clarity and geopolitical frictions persistGold (XAU/USD) advances modestly on Friday as traders seem to book profits ahead of the weekend, yet clings to gains of over 0.51% after reaching a seven-week high of $4,353. At the time of writing, XAU/USD trades at $4,302 as traders digest comments from Federal Reserve (Fed) officials.
Author  FXStreet
Yesterday 01: 34
Gold (XAU/USD) advances modestly on Friday as traders seem to book profits ahead of the weekend, yet clings to gains of over 0.51% after reaching a seven-week high of $4,353. At the time of writing, XAU/USD trades at $4,302 as traders digest comments from Federal Reserve (Fed) officials.
placeholder
Ethereum Price Slips Lower — $3,000 Looms as the Key BattlegroundEthereum is attempting to recover from a $3,026 low but remains below $3,200 and the 100-hour SMA, with a bearish trend line near $3,175 capping rebounds as bulls need a clean break above $3,200 to target $3,250–$3,400, while a drop below $3,050 risks a retest of $3,000 and $2,940.
Author  Mitrade
Yesterday 03: 25
Ethereum is attempting to recover from a $3,026 low but remains below $3,200 and the 100-hour SMA, with a bearish trend line near $3,175 capping rebounds as bulls need a clean break above $3,200 to target $3,250–$3,400, while a drop below $3,050 risks a retest of $3,000 and $2,940.
placeholder
Macro Analysts: Hawkish Japan Could Push Bitcoin Below $70KAnalysts predict Bitcoin may face further declines towards the $70,000 mark if the Bank of Japan raises interest rates as expected.
Author  Mitrade
Yesterday 05: 48
Analysts predict Bitcoin may face further declines towards the $70,000 mark if the Bank of Japan raises interest rates as expected.
placeholder
Bitcoin Slides 5% as Sellers Lean In — Can BTC Reclaim $88,000?Bitcoin has dropped back below $88,000 after rolling over from $90,500, with price still trading under the 100-hour Simple Moving Average. The sell-off found a floor at $85,151, and BTC is now consolidating near that base, but rebounds are facing pressure from a bearish trend line around $89,000. Bulls need to retake $88,000–$89,000 to ease downside risk; failure to do so keeps $85,500–$85,000 and then $83,500 in play, with $80,000 as the deeper “line in the sand.” Bitcoin (BTC) is back in damage-control mode after a sharp pullback wiped out recent gains. The price failed to reclaim the $90,000–$90,500 band, rolled over, and slid through $88,500 before briefly dipping under $87,000. Buyers did show up around $85,000, but the rebound so far looks more like stabilization than a clear trend reversal. Bitcoin dips hard, finds a bid near $85,000(h3) BTC’s latest move lower began when it couldn’t build follow-through above $90,000 and $90,500. Once that upside stalled, sellers took control and pushed price down through $88,500. The slide accelerated enough to spike below $87,000, but the market didn’t free-fall. Bulls defended the $85,000 zone, printing a low at $85,151. Since then, Bitcoin has been consolidating below the 23.6% Fibonacci retracement of the drop from the $93,560 swing high to the $85,151 low — a clue that the bounce is still shallow and that sellers haven’t fully backed off yet. Structurally, BTC is still on the back foot: It’s trading below $88,000, and It remains below the 100-hour Simple Moving Average, keeping short-term trend pressure pointed downward. Resistance is layered, and $89,000 is the problem area(h3) If bulls try to turn this into a recovery, they’ll have to climb through multiple ceilings in quick succession. First, BTC faces resistance around $87,150, followed by a more meaningful barrier near $87,500. From there, the market’s attention snaps back to $88,000 — the level BTC just lost and now needs to reclaim. A close back above $88,000 would improve the tone, but it doesn’t solve the bigger issue: there’s a bearish trend line on the hourly BTC/USD chart (Kraken feed) with resistance near $89,000, which also lines up with the next technical hurdle. If BTC can push through $89,000 and hold, the rebound could extend toward $90,000, with follow-through targets at $91,000 and $91,500. But until price clears that $88,000–$89,000 zone, rallies are at risk of being sold rather than chased. If BTC fails to reclaim resistance, the downside path is clear(h3) The near-term bear case is simple: if Bitcoin can’t climb back above the $87,000 area and keep traction, sellers may attempt another leg lower. Support levels line up like this: Immediate support: $85,500 First major support: $85,000 Next support: $83,500 Then $82,500 in the near term Below that, the major “don’t break this” level is still $80,000. If BTC slips under $80,000, the risk of acceleration to the downside increases significantly — not because it’s magic, but because it’s the kind of psychological and structural level that tends to trigger forced de-risking. Indicators: momentum still leans bearish(h3) The intraday indicators aren’t offering much comfort yet: Hourly MACD is losing pace in the bearish zone. Hourly RSI remains below 50, suggesting sellers still have the upper hand on short timeframes. So while the $85,000 defense held for now, the market hasn’t flipped bullish — it’s just stopped bleeding.
Author  Mitrade
11 hours ago
Bitcoin has dropped back below $88,000 after rolling over from $90,500, with price still trading under the 100-hour Simple Moving Average. The sell-off found a floor at $85,151, and BTC is now consolidating near that base, but rebounds are facing pressure from a bearish trend line around $89,000. Bulls need to retake $88,000–$89,000 to ease downside risk; failure to do so keeps $85,500–$85,000 and then $83,500 in play, with $80,000 as the deeper “line in the sand.” Bitcoin (BTC) is back in damage-control mode after a sharp pullback wiped out recent gains. The price failed to reclaim the $90,000–$90,500 band, rolled over, and slid through $88,500 before briefly dipping under $87,000. Buyers did show up around $85,000, but the rebound so far looks more like stabilization than a clear trend reversal. Bitcoin dips hard, finds a bid near $85,000(h3) BTC’s latest move lower began when it couldn’t build follow-through above $90,000 and $90,500. Once that upside stalled, sellers took control and pushed price down through $88,500. The slide accelerated enough to spike below $87,000, but the market didn’t free-fall. Bulls defended the $85,000 zone, printing a low at $85,151. Since then, Bitcoin has been consolidating below the 23.6% Fibonacci retracement of the drop from the $93,560 swing high to the $85,151 low — a clue that the bounce is still shallow and that sellers haven’t fully backed off yet. Structurally, BTC is still on the back foot: It’s trading below $88,000, and It remains below the 100-hour Simple Moving Average, keeping short-term trend pressure pointed downward. Resistance is layered, and $89,000 is the problem area(h3) If bulls try to turn this into a recovery, they’ll have to climb through multiple ceilings in quick succession. First, BTC faces resistance around $87,150, followed by a more meaningful barrier near $87,500. From there, the market’s attention snaps back to $88,000 — the level BTC just lost and now needs to reclaim. A close back above $88,000 would improve the tone, but it doesn’t solve the bigger issue: there’s a bearish trend line on the hourly BTC/USD chart (Kraken feed) with resistance near $89,000, which also lines up with the next technical hurdle. If BTC can push through $89,000 and hold, the rebound could extend toward $90,000, with follow-through targets at $91,000 and $91,500. But until price clears that $88,000–$89,000 zone, rallies are at risk of being sold rather than chased. If BTC fails to reclaim resistance, the downside path is clear(h3) The near-term bear case is simple: if Bitcoin can’t climb back above the $87,000 area and keep traction, sellers may attempt another leg lower. Support levels line up like this: Immediate support: $85,500 First major support: $85,000 Next support: $83,500 Then $82,500 in the near term Below that, the major “don’t break this” level is still $80,000. If BTC slips under $80,000, the risk of acceleration to the downside increases significantly — not because it’s magic, but because it’s the kind of psychological and structural level that tends to trigger forced de-risking. Indicators: momentum still leans bearish(h3) The intraday indicators aren’t offering much comfort yet: Hourly MACD is losing pace in the bearish zone. Hourly RSI remains below 50, suggesting sellers still have the upper hand on short timeframes. So while the $85,000 defense held for now, the market hasn’t flipped bullish — it’s just stopped bleeding.
goTop
quote