

Canadian Dollar trims losses as USD softens amid brighter market mood
- Canadian Dollar advances moderately as market sentiment improves.
- USD/CAD is pulling back despite the Fed’s hawkish stance and lower oil prices.
- Current Canadian Dollar recovery is likely to be short-lived.
The Canadian Dollar (CAD) is trading higher on Wednesday to snap a five-day sell-off that has sent the Loonie 1.7% lower. A positive risk sentiment, coupled with lower US yields, is hurting the safe-haven US Dollar and offsetting the CAD’s adverse fundamental background.
The absence of key US releases in the US of Canada is allowing the Canadian Dollar to regain some of the ground lost over the previous days. Upside attempts, however, are likely to be short-lived. The “higher for longer” Federal Reserve (Fed) stance, in opposition to the Bank of Canada’s (BoC) dovish outlook, is expected to support the US Dollar. Beyond that, the lower Oil prices are an extra weight for the commodity-linked Loonie.
On Wednesday, the release of the Fed’s beige book and speeches from Fed members Mester and Bowman are the only events worth mentioning. After Tuesday’s speech by Fed Chair Jerome Powell, their impact on the pair is limited.
Daily digest market movers: USD/CAD loses steam at five-month highs
Canadian Dollar is trading 0.2% higher on Wednesday after having lost nearly 2% in a five-day sell-off.
The hawkish Fed stance, confirmed on Wednesday by Fed Chair Powell, and the dovish outlook of the BoC, which is expected to start cutting rates in June, are acting as a headwind for the CAD.
On Wednesday, Fed Chair Powell warned about the lack of progress on inflation, suggesting that the bank will have to keep rates at restrictive levels for a longer time.
Bets for a Fed rate cut in July have dropped to 37% from 50% at the beginning of the week. Investors are now pricing in 40 bps of cuts in 2024, down from 150 BP in January.
EIA Crude Oil stocks have increased by 2.735 million barrels. against expectations of 1.65 million. Incrementally, this is weighing further on Crude prices and also on the CAD.
On Tuesday, Canadian inflation data showed mixed figures. Headline CPI accelerated to a 2.9% yearly rate from 2.8% in the previous month. The Core CPI eased to 2%, its lowest level in three years.
These figures endorse the view that the Bank of Canada will be able to cut rates soon, probably in June, and increase negative pressure on the pair.
Canadian Dollar price today
The table below shows the percentage change of Canadian Dollar (CAD) against listed major currencies today. Canadian Dollar was the weakest against the Japanese Yen.
| USD | EUR | GBP | CAD | AUD | JPY | NZD | CHF | |
| USD | -0.15% | 0.01% | -0.05% | 0.05% | -0.09% | -0.02% | -0.03% | |
| EUR | 0.17% | 0.18% | 0.13% | 0.21% | 0.05% | 0.11% | 0.11% | |
| GBP | -0.04% | -0.18% | -0.08% | 0.03% | -0.14% | -0.07% | -0.07% | |
| CAD | 0.02% | -0.13% | 0.03% | 0.08% | -0.08% | -0.02% | -0.01% | |
| AUD | -0.05% | -0.18% | -0.02% | -0.08% | -0.16% | -0.10% | -0.07% | |
| JPY | 0.09% | -0.07% | 0.09% | 0.05% | 0.12% | 0.04% | 0.06% | |
| NZD | 0.05% | -0.13% | 0.03% | 0.01% | 0.09% | -0.07% | -0.01% | |
| CHF | 0.04% | -0.11% | 0.07% | 0.01% | 0.10% | -0.06% | 0.00% |
The heat map shows percentage changes of major currencies against each other. The base currency is picked from the left column, while the quote currency is picked from the top row. For example, if you pick the Euro from the left column and move along the horizontal line to the Japanese Yen, the percentage change displayed in the box will represent EUR (base)/JPY (quote).
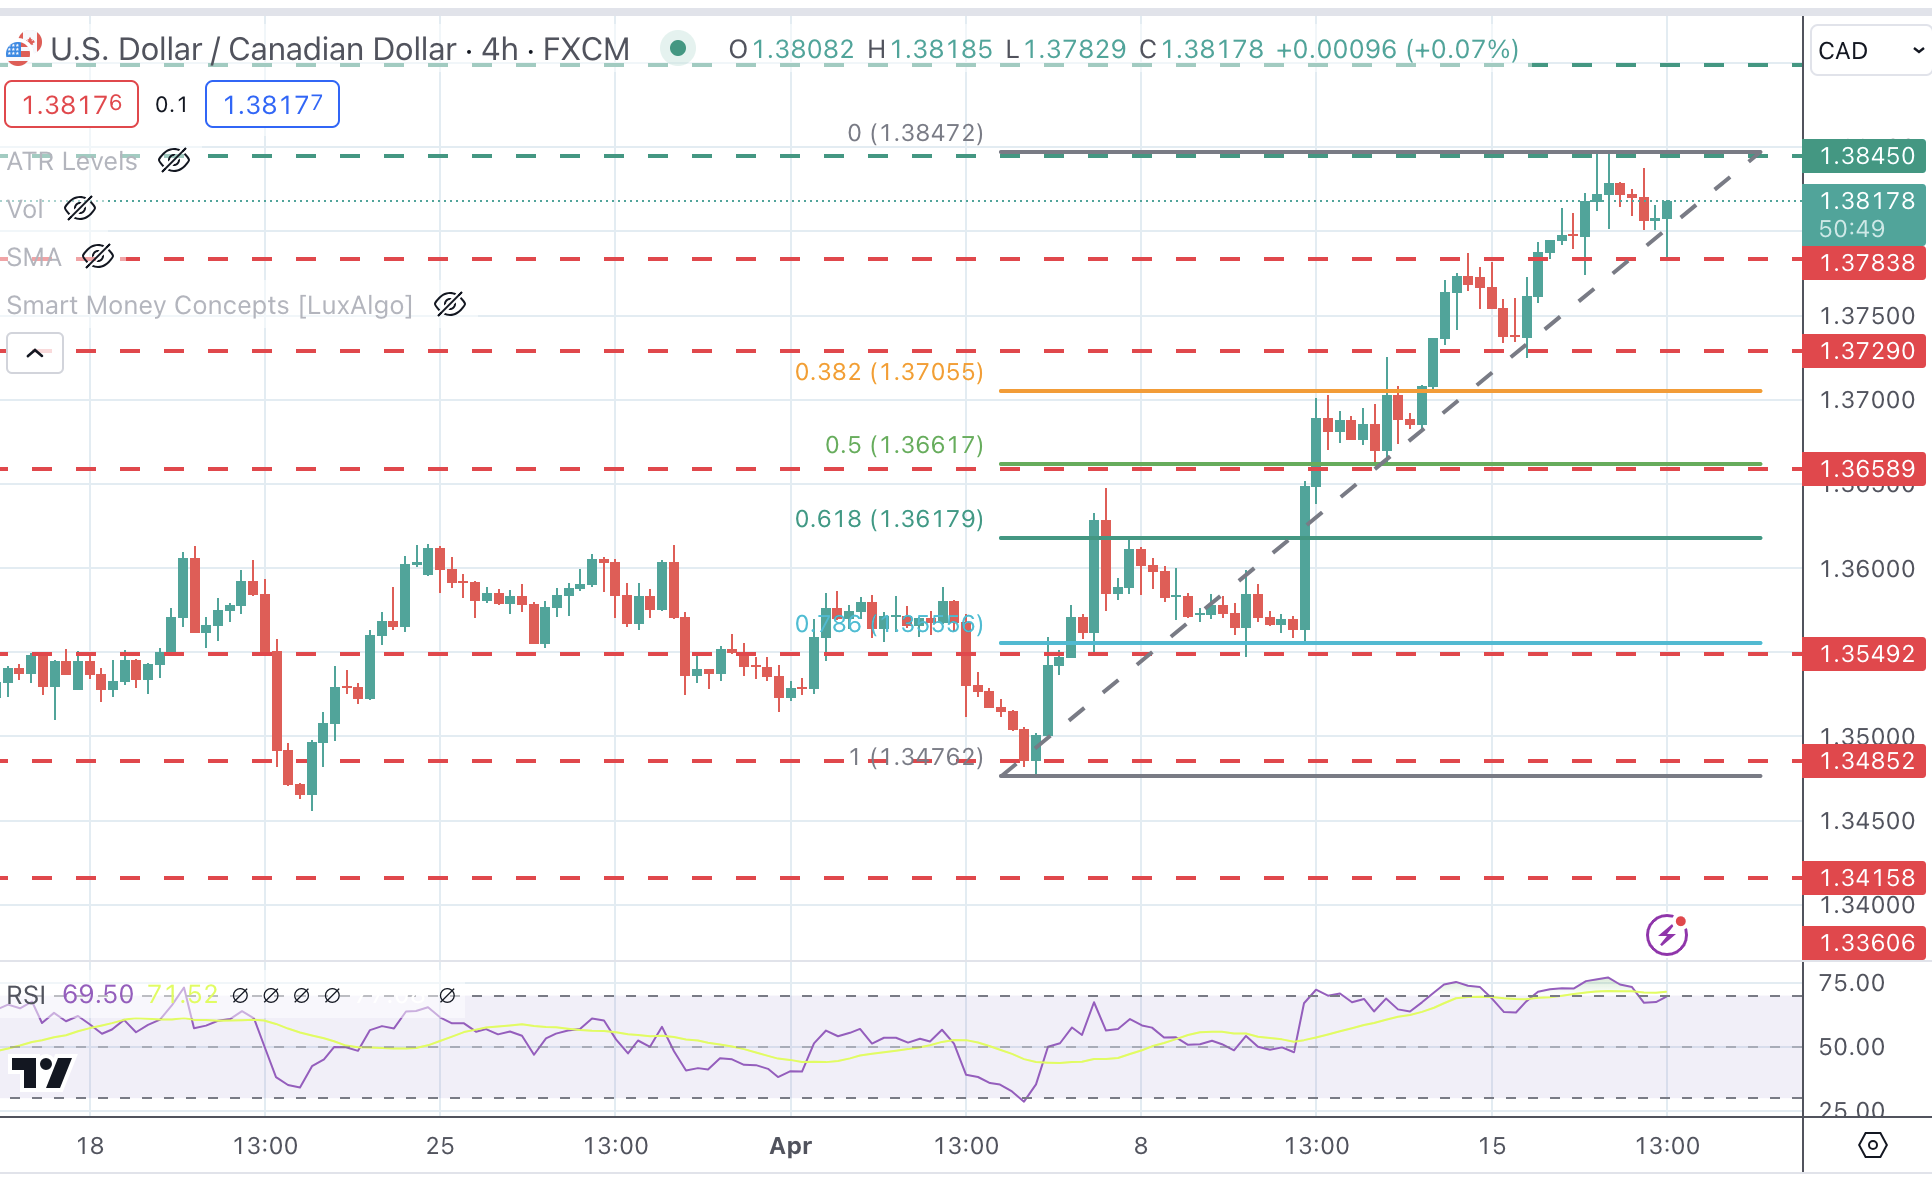
Technical analysis: USD/CAD in corrective pullback with 1.3785 holding bears for now
The broader US Dollar trend remains intact, although the pair is going through a corrective pullback from overbought levels, following a five-day rally.
Bears are expected to be challenged at 1.3785, ahead of the intra-week low at 1.3728. The 38.2% Fibonacci retracement level of April’s rally is at 1.3705. On the upside, the immediate resistance is at 1.3845. Further up, the next target would be November 2023 high at 1.3900.
USD/CAD 4-Hour Chart
Risk sentiment FAQs
In the world of financial jargon the two widely used terms “risk-on” and “risk off'' refer to the level of risk that investors are willing to stomach during the period referenced. In a “risk-on” market, investors are optimistic about the future and more willing to buy risky assets. In a “risk-off” market investors start to ‘play it safe’ because they are worried about the future, and therefore buy less risky assets that are more certain of bringing a return, even if it is relatively modest.
Typically, during periods of “risk-on”, stock markets will rise, most commodities – except Gold – will also gain in value, since they benefit from a positive growth outlook. The currencies of nations that are heavy commodity exporters strengthen because of increased demand, and Cryptocurrencies rise. In a “risk-off” market, Bonds go up – especially major government Bonds – Gold shines, and safe-haven currencies such as the Japanese Yen, Swiss Franc and US Dollar all benefit.
The Australian Dollar (AUD), the Canadian Dollar (CAD), the New Zealand Dollar (NZD) and minor FX like the Ruble (RUB) and the South African Rand (ZAR), all tend to rise in markets that are “risk-on”. This is because the economies of these currencies are heavily reliant on commodity exports for growth, and commodities tend to rise in price during risk-on periods. This is because investors foresee greater demand for raw materials in the future due to heightened economic activity.
The major currencies that tend to rise during periods of “risk-off” are the US Dollar (USD), the Japanese Yen (JPY) and the Swiss Franc (CHF). The US Dollar, because it is the world’s reserve currency, and because in times of crisis investors buy US government debt, which is seen as safe because the largest economy in the world is unlikely to default. The Yen, from increased demand for Japanese government bonds, because a high proportion are held by domestic investors who are unlikely to dump them – even in a crisis. The Swiss Franc, because strict Swiss banking laws offer investors enhanced capital protection.
Recommended Articles


